INDICATORS
Identify When To Buy And Sell
The Pivot Detector Oscillator, Simplified
See how you can use a simplified version of the Pid oscillator to improve your timing by leaps and bounds.
A coherent unification model for trend indicators and oscillators is to technical analysis what a unification model of the microcosmos and the macrocosmos is to physics. Although both models may still be far from being constructed, there is nonetheless a way of using trend indicators and oscillators to derive virtually instantaneous signals. Here I will describe a simplified version of the pivot detector (Pid) oscillator and its signals, which were used in Daedalus, an add-on for MetaStock I created some years ago.
The Dr. Jekyll & Mr. Hyde RSI
Among the various better-known oscillators, the relative strength index (Rsi) stands out. J. Welles Wilder introduced the Rsi in his book New Concepts In Technical Trading Systems, and it has been a standard tool for technical analysts ever since. By its construction, the Rsi takes on values between zero and 100, and Wilder proposed a 14-period parameter for it along with the 30 to 70 levels as oversold/overbought thresholds. The Rsi, however, does not differ from other classic technical oscillators in that it produces multiple erroneous signals during strong trending markets.
To my knowledge, the first observation about the specific oscillating character of the Rsi was attributed to Andrew Cardwell, who is considered by many to be the world’s leading authority on the Rsi. Cardwell noticed, among others, that during long-term bullish markets, the 14-period Rsi (Rsi(14) for short) does not usually fall below 40, nor does it usually rise above 60 during bearish markets.
The first publicly available and extended information on the subject of the bullish/bearish oscillation ranges of the Rsi appeared in Constance Brown’s book Technical Analysis For The Trading Professional. In it, Brown argues that during bullish markets, the Rsi(14) usually oscillates between 40 and 80, whereas during bearish markets, it usually oscillates between 20 and 65.

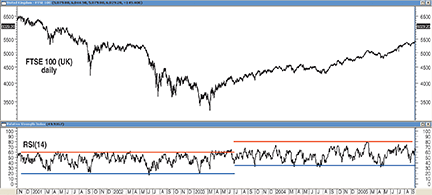
Figure 1: the oscillating character of the rsi. On the left part of this daily chart of FTSE 100 (November 2000–June 2003), the RSI(14) oscillates between 20 and 60, whereas on the right part of the chart (July 2003–September 2005), the RSI(14) oscillates between 35 and 80.
In Figure 1, you can see the daily chart of Ftse100 (United Kingdom). It is clear in this chart that the trending direction of the market has a strong impact in the oscillating character of the Rsi(14). The Pid oscillator and its signals rely heavily in bullish/bearish oscillation ranges of the Rsi(14).