CYCLES
PQ Wall Of Waves
Fibonacci In Time And Price
You can apply this technical tool of cycle analysis to smaller market cycles, which are more useful to traders than the larger ones.
In Business Cycles, the seminal work on the title subject, economist Joseph A. Schumpeter presented a framework for business cycle analysis that included the Kondratieff economic long wave as his essential tool for understanding and describing the capitalist process. His work goes a long way to explain the cyclical expansion and contraction of international free market capitalism and related global financial market activity, including the current global financial crisis and impending debt collapse.
Dividing cycles
Schumpeter also presented a framework for smaller cycles that included 18 regular trade cycles, or Kitchin cycles, in every long wave. I accepted this concept when I read Schumpeter’s work in the 1980s, but then in the early 1990s I discovered another system for understanding the long wave family of cycles in the work of the late market technician “PQ” Wall. Years of extended research on the technical implications of Wall’s cycle work led me down a path of technical analysis that I refer to as “theory 144 analytics.”
Central to Wall’s approach is what he theorized as the inherent “threeness” and “fourness” of cycle relationships. His conclusions were derived from his knowledge of world history and his unorthodox approach to markets and philosophy. “PQ,” his nickname, was short for “philosophy quotient,” and his philosophy played a major role in his distilling cycles and their interrelationships into a novel system of divisibility — that is, threeness and fourness.
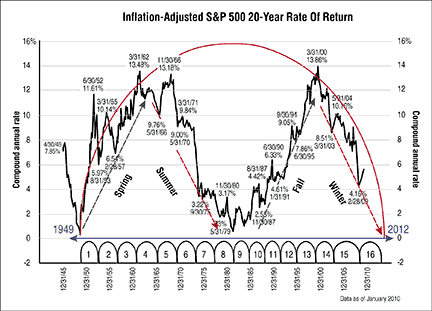
Wall divided a long wave by four into spring, summer, autumn, and winter and further divided the long wave seasons by four into the regular trade cycles (Kitchin cycles). Wall’s method gives you 16 regular trade cycles in a long wave instead of Schumpeter’s 18. This may not appear to be a major distinction, but it is an important contribution to cycle research and technical analysis, due to the downstream implications for the smaller cycles and the clarity his discovery provides.

Figure 1: Inflation-Adjusted S&P 20-Year Rate of Return. Here you see the long wave, the long wave seasons (spring, summer, autumn, and winter), and the 16 regular trade cycles.