options
Stacking The Odds In Your Favor
The Expiration Trade
In this world of algorithmic trading, how can an independent trader stand a chance? Here’s one way you can trade options to get an edge in the markets.
We have all heard that 70% to 80% of all options expire worthless. Many of us have purchased options, only to watch the market move in the direction we anticipate and still lose money as the option we bought drops to zero. I’m not sure whether the percentage of options that expire worthless is correct and there have been articles published about that statement in general, but the one thing I do know is that all out-of-the-money options expire worthless. The key is to determine where that “out of the money” is.
So what’s your edge?
The exciting thing about selling options is that you can stack the odds in your favor to get an edge in the markets. But edges are hard to find, even more now with so many supercomputers looking at patterns and algorithms trading in fractions of a second. In such an environment, is it even possible for an independent part-time trader to get a leg up in the market?
Successful option selling requires determining where the market won’t go. Can you sell an option with only one week till expiration and make money? How about limiting your risks?
Let’s take a look
The November US Treasury bond options expired on Friday, October 22, 2010. They are based on the December futures contract prices. How are we going to stack the odds in our favor? We have limited our time to holding the position for a maximum of five days. We are looking at selling slightly out-of-the-money options, which represent time value only. That time is diminishing rapidly. If we are right, the option will be zero at the close on Friday. So essentially, we are putting time in our favor.
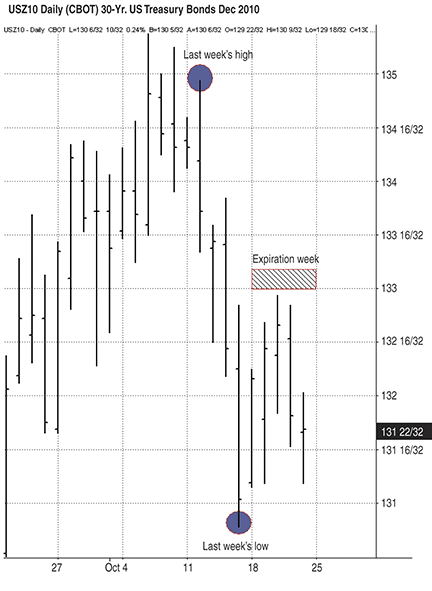
Let’s start out by looking at the daily chart of the December T-bond contract (Figure 1). Here, you see a short-term selloff, with the market closing lower the last seven sessions. The market closes near 131.00.

Figure 1: december t-bond contract, daily. Here you see a short-term selloff, with the market closing lower than the last seven sessions.