TRADING TECHNIQUEs
Volume As Well As Price
Comparative Trading Volume
The first part of this series looked at how price action can be used to anticipate future price movement in the S&P 500 Spdr exchange traded fund. This time, we add trading volume to the mix, but not in the typical way.
As technicians, we depend primarily on two variables to augment our predictive ability: price and volume. In my previous article, the emphasis was on using yesterday’s action to determine the price movement of the Standard & Poor’s 500 depositary receipt (Spdr) exchange traded fund (Spy), also known as spiders, over the next three days. This time, I combine two independent variables: a price change in the spiders together with trading volume, but using volume in a less conventional way.
Most market participants assess trading volume by comparing today’s activity against a 20- or 50-day moving average, but they aggregate trading days without making allowances for the strength or weakness of price movements. In this article, I measure yesterday’s trading activity in conjunction with a percentage movement in the price of spiders.
Trading volume
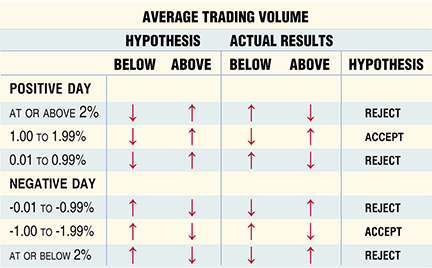
In the 474 trading days under investigation, the average trading volume for the spiders was 234 million shares; therefore, a positive trading day with activity above this score is seen as bullish, but we are not accounting for yesterday’s price change. On those 37 days with a strong advance (a percentage gain at or above 2%), the average trading volume was 306 million shares; the watermark for those 37 days is 306 million shares, not 234 million. This article provides a way to correct this oversight by assessing those days with similar movements in price within each of the six pricing categories.
In order to perform this analysis, the price of the spiders is broken down into the same six categories as my previous article, but once I construct the percentage daily price change I delve deeper by separating each pricing category into above-average and below-average volume.

Figure 1: hypothesis vs. actual results. When separating trading volume into below/above average, the analysis supported this hypothesis for the middle category, but not for the strongest or weakest categories.