REAL WORLD
Using Candlesticks And Simple Moving Averages
Gap Fill And Go
Here’s a look at two trades using a strategy you can use almost every day.
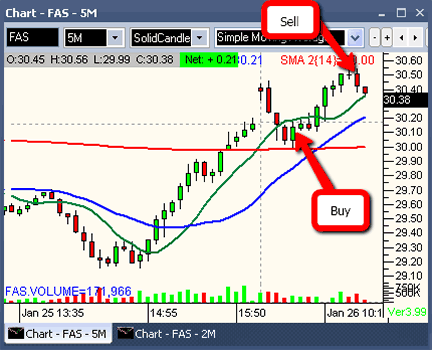
I’m going to show you two trades using a bread & butter strategy you can use almost every day to capture profits from the stock market. As you can see from Figures 1 and 2, I use candlesticks and moving averages on a five-minute time frame. I use the eight- and 21-period simple moving averages (Sma), which are displayed in green and blue, respectively, along with the 200-period Sma (red). Of course, eight and 21 are Fibonacci numbers. In addition, the 200-day Sma is watched by so many that it has practically become self-fulfilling. I call the technique the “gap fill and go.”
The setup
To set up these trades, please observe that the eight- and 21-period Smas are in an uptrend on the five-minute chart. While not shown, the Smas are also in an uptrend on the higher time frame charts, such as the 15-minute and 60-minute charts.
Next, we have a bullish gap up on the opening bell. Now the hardest part of the trade is sitting on your hands for the first 30 minutes of trading. You want to just sit and observe. Then, you may begin to notice the gaps are starting to fill. This is just a version of the well-tested slogan, “Buy the dips and sell the rallies.” You are just waiting for the dip to occur in the predetermined uptrend.

Figure 1: the fas trade. The eight- and 21-period SMAs are in an uptrend and there is a bullish gap up on the opening bell. Once you see a potential winning trade, you calculate your risk-reward ratio, position size, and place your protective stop.