OPTIONS
Using Sample Variance
Backtesting Option Strategies
Looking for a quick way to backtest option strategies? You can use Excel to count occurrences of historical prices outside a price band you set to develop an expectation for future price movement. Here’s how.
So much of the option trader’s life has been enhanced over just the past 10 or so years. We have radically lower commissions — $0.15 to $1.50 per contract, plus various ticket charge plans; we have tighter markets, with high-volume contracts just one penny apart; we have better software with risk curves, what-if scenarios, and charting, with brokers and vendors continue to enhance their offerings; and finally, we have easier access to futures and world markets for intermarket hedging.
Only one aspect of the option trading experience remains, more or less, as it was years ago — option strategy backtesting. If I put on this Spx or Spy or Rut or Etf or Xyz butterfly, condor, calendar, or double diagonal, what are my chances of success based on the recent past? That is the biggest question for every option trader.
For a back-of-the-envelope type calculation, some use deltas as shorthand for the probability of going in-the-money. For example, an option with a 10 delta will have roughly a 10% chance of doing so. Actual probability math is much more complex (see my December 1997 S&C article), but the answers usually come out close enough. Some software calculates “probability of expiration” or “probability of touching” (strike) for you. Thinkorswim does this, for example.

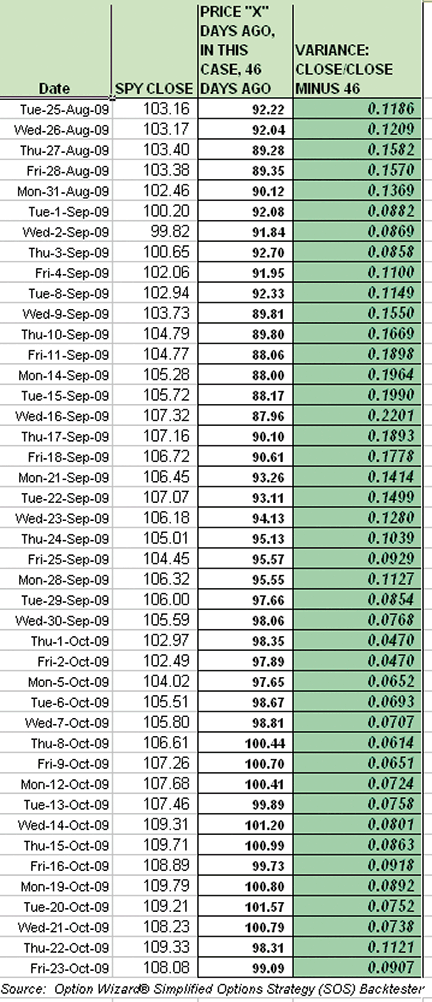
Figure 1: breaking out. Once a bull market run began here in the SPY, it exceeded the daily variance bands (that is, last price was constantly equal to or greater than 7.5% versus price 46 days earlier) nearly every day for two months; there was no regression for those waiting for a pullback — an important consideration for the option trader who must be alert and nimble, and typically does not have one or two years, like a long-term position trader, for a position to come back.