TRADERS’ TIPS
July 2011
Here is this month’s selection of Traders’ Tips, contributed by various developers of technical analysis software to help readers more easily implement some of the strategies presented in this and other issues.
Other code appearing in articles in this issue is posted in the Subscriber Area of our website at https://technical.traders.com/sub/sublogin.asp. Login requires your last name and subscription number (from mailing label). Once logged in, scroll down to beneath the “Optimized trading systems” area until you see “Code from articles.” From there, code can be copied and pasted into the appropriate technical analysis program so that no retyping of code is required for subscribers.
You can copy these formulas and programs for easy use in your spreadsheet or analysis software. Simply “select” the desired text by highlighting as you would in any word processing program, then use your standard key command for copy or choose “copy” from the browser menu. The copied text can then be “pasted” into any open spreadsheet or other software by selecting an insertion point and executing a paste command. By toggling back and forth between an application window and the open web page, data can be transferred with ease.
This month’s tips include formulas and programs for:
- TRADESTATION: COLOR-BASED SYSTEM
- METATRADER 5: COLOR-BASED SYSTEM
- BLOOMBERG: COLOR-BASED SYSTEM
- AMIBROKER: COLOR-BASED SYSTEM
- eSIGNAL: COLOR-BASED SYSTEM
- THINKORSWIM.COM: COLOR-BASED SYSTEM
- WEALTH-LAB: COLOR-BASED SYSTEM
- WORDEN BROTHERS TC2000: SCANNING FOR SHORT-TERM TRADES
- AIQ: COLOR-BASED SYSTEM
- TRADERSSTUDIO: COLOR-BASED SYSTEM
- STRATASEARCH: COLOR-BASED SYSTEM
- NEUROSHELL TRADER: COLOR-BASED SYSTEM
- NINJATRADER: COLOR-BASED SYSTEM
- UPDATA: COLOR-BASED SYSTEM
- TRADESIGNAL: COLOR-BASED SYSTEM
- VT TRADER: COLOR-BASED SYSTEM
- COLOR-BASED SYSTEM — KRAUT ARTICLE CODE

TRADESTATION: COLOR-BASED SYSTEM
In “A Color-Based System For Short-Term Trading” in this issue, author Edgar Kraut describes a swing-trading system that utilizes the color of volume bars. It is based on the relationship of the current bar’s close and volume as compared to the close and volume 10 bars ago.
We have prepared indicator code (_RainbowVolume_Ind) that plots the volume and is colored based on the criteria specified in Kraut’s article, and a strategy (_RainbowVolume_Strat), which enters on the next bar if the current bar is a green or blue bar. The exit is a percentage trail of the highest bar close since entry.
To download the EasyLanguage code for this indicator and strategy, go to the TradeStation and EasyLanguage support forum (https://www.tradestation.com/Discussions/forum.aspx?Forum_ID=213) and search for the file “_RainbowVolume.eld.” The code is also shown below.
A sample chart is shown in Figure 1.
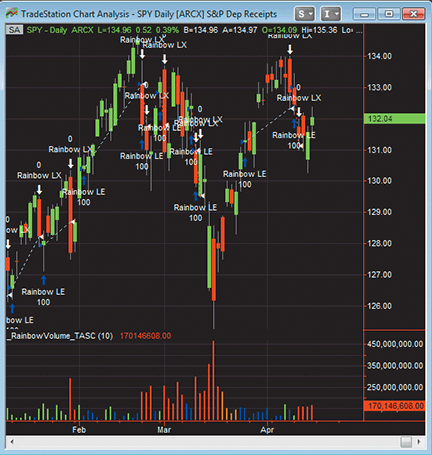
Figure 1: TRADESTATION, Color-Based System. Here is a daily chart of the SPY with Kraut’s indicator and strategy plotted. Entries are on the next bar following a green or blue volume bar, and the exit is a trailing stop based on a percentage amount below the highest bar close since entry.
EASYLANGUAGE CODE FOR COLOR-BASED SYSTEM

_RainbowVolume_Ind (Indicator)

{ TASC Article, July, 2011 }
{ A Color-Based System For Short-Term Trading }

inputs:
	NumBars( 10 ) ;

variables:
	Orange( 0 ),
	PlotColor( 0 ),
	MyVol( 0 ) ;

if CurrentBar = 1 then
	Orange = RGB( 255, 127, 0 ) ;

if BarType >= 2 and BarType < 5 then
	MyVol = Volume
else
	MyVol = Ticks ;

if C > C[NumBars] and MyVol > MyVol[NumBars] then
	PlotColor = Green
else if C > C[NumBars] and MyVol < MyVol[NumBars] then
	PlotColor = Blue
else if C < C[NumBars] and MyVol < MyVol[NumBars] then
	PlotColor = Orange
else if C < C[NumBars] and MyVol > MyVol[NumBars] then
	PlotColor = Red ;

Plot1( MyVol, "Volume", PlotColor ) ;


_RainbowVolume_Strat (Strategy)

{ TASC Article, July, 2011 }
{ A Color-Based System For Short-Term Trading }

inputs:
	LookBackBars( 10 ),
	TrailStopPct( 1 ) ; { Enter in percentage points }

variables:
	MyVol( 0 ),
	EP( 0 ),
	StopCalc( 0 ),
	LongStop( 0 ),
	GreenBar( false ),
	BlueBar( false ) ;

if BarType >= 2 and BarType < 5 then
	MyVol = Volume
else
	MyVol = Ticks ;

EP = EntryPrice ;
GreenBar = C > C[LookBackBars] and
 MyVol > MyVol[LookBackBars] ;
BlueBar = C > C[LookBackBars] and
 MyVol < MyVol[LookBackBars] ;

{ Go long on Green or Blue bar }
if GreenBar or BlueBar then
	Buy ( "Rainbow LE" ) next bar at market ;

StopCalc = C - C * TrailStopPct * 0.01 ;

{ Percent Trailing Exit }
if EP > 0 then { a position exists }
	begin
	LongStop = MaxList( StopCalc, LongStop ) ;
	Sell ( "Rainbow LX" ) next bar LongStop stop ;
	end
else
	LongStop = 0 ;
This article is for informational purposes. No type of trading or investment recommendation, advice, or strategy is being made, given, or in any manner provided by TradeStation Securities or its affiliates.

METATRADER 5: COLOR-BASED SYSTEM
Here is the code for MetaTrader 5 to implement Edgar Kraut’s color-based system, both as a text file and as a downloadable .mq5 file named “Rainbow.mq5.” The indicator is named rainbow.
A sample chart is shown in Figure 2.
Click here to download .mq5 file
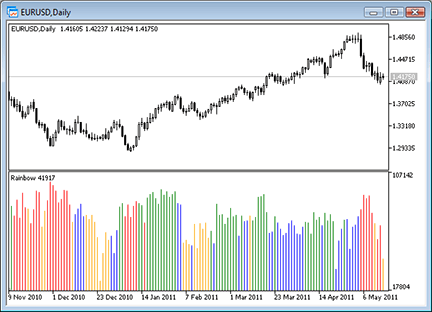
FIGURE 2: METAQUOTES 5, COLOR-BASED STRATEGY. Here is a sample MetaTrader 5 chart implementing Edgar Kraut’s color-based system on a daily EUR/USD chart.
//+------------------------------------------------------------------+
//|                                                      Rainbow.mq5 |
//|                        Copyright 2011, MetaQuotes Software Corp. |
//|                                              https://www.mql5.com |
//+------------------------------------------------------------------+
#property copyright "Copyright 2011, MetaQuotes Software Corp."
#property link      "https://www.mql5.com"
#property version   "1.00"
#property indicator_separate_window
#property indicator_buffers 2
#property indicator_plots   1
//--- plot Rainbow
#property indicator_label1  "Rainbow"
#property indicator_type1   DRAW_COLOR_HISTOGRAM
//--- 4 colors for 4 conditions
#property indicator_color1  clrGreen,clrBlue,clrOrange,clrRed
#property indicator_style1  STYLE_SOLID
#property indicator_width1  1
//--- input parameters
input int                  period=10;              // how many bars ago we compare to
input ENUM_APPLIED_VOLUME  use_volume=VOLUME_TICK; // tick or trade volume use
//--- indicator buffers
double         RainbowBuffer[];
double         RainbowColors[];
//--- auxiliary variable
bool real_volume;
//+------------------------------------------------------------------+
//| Custom indicator initialization function                         |
//+------------------------------------------------------------------+
int OnInit()
  {
//--- indicator buffers mapping
   SetIndexBuffer(0,RainbowBuffer,INDICATOR_DATA);
   SetIndexBuffer(1,RainbowColors,INDICATOR_COLOR_INDEX);
//--- which volume type we use
   real_volume=use_volume==VOLUME_REAL;
//---
   IndicatorSetInteger(INDICATOR_DIGITS,0);
//---
   return(0);
  }
//+------------------------------------------------------------------+
//| Custom indicator iteration function                              |
//+------------------------------------------------------------------+
int OnCalculate(const int rates_total,
                const int prev_calculated,
                const datetime &time[],
                const double &open[],
                const double &high[],
                const double &low[],
                const double &close[],
                const long &tick_volume[],
                const long &volume[],
                const int &spread[])
  {
//--- start position for calculation
   int start=prev_calculated;
   if(start>0) start--;    // for f
   else start=period;      // for first calc we must add forward shift equals period variable

//--- main cycle
   for(int i=start;i<rates_total;i++)
     {
      //--- to take current volume and volume for period bars ago
      long v1,v2;
      //--- if we use trade volume
      if(real_volume)
        {
         v1=volume[i];
         v2=volume[i-period];
        }
      //--- we use tick volume
      else
        {
         v1=tick_volume[i];
         v2=tick_volume[i-period];
        }
      //--- histogram value
      RainbowBuffer[i]=(double)v1;
      //--- now we set color for histogram
      if(close[i]>close[i-period])
        {
         //--- price is greater then period bars before
         if(v1>v2) RainbowColors[i]=0; // index of Green color
         else RainbowColors[i]=1;      // index of Blue color
        }
      else
        {
         //--- price is less then period bars before
         if(v1<v2) RainbowColors[i]=2; // index of Orange color
         else RainbowColors[i]=3;      // index of Red color
        }
     }

//--- return value of prev_calculated for next call
   return(rates_total);
  }
//+------------------------------------------------------------------+

BLOOMBERG: COLOR-BASED SYSTEM
Figure 3 shows the S&P 500 futures with volume bars underneath that are colored according to the conditions detailed in Edgar Kraut’s article in this issue, “A Color-Based System For Short-Term Trading.”
Many technicians look for volume spikes to accompany breakouts and breakdowns as additional confirmation of a move. By coloring the volume bars on this chart as described by Kraut, we can see that when the S&P 500 futures broke through resistance points established by recent highs, the condition was confirmed by green volume bars that quickly establish the area where volume buildup corresponded to the upside breakout in the market in both September and December 2010. Both of these moves followed consolidation periods, and neither was contradicted by a fall below the 1% stop before profits could be locked in.
Using the CS.Net framework within the Stdy<GO> function on the Bloomberg Terminal, C# or Visual Basic code can be written to display the colored volume bars. The C# code for this indicator is shown here. All Bloomberg code contributions to S&C’s Traders’ Tips column can also be found in the sample files provided with regular Sdk updates, and the studies will be included in the Bloomberg global study list.
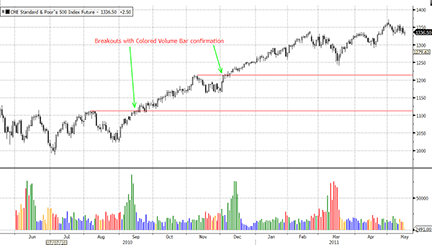
Figure 3: BLOOMBERG, Color-Based System. This chart shows the active futures continuous chart for the S&P 500. After almost four months of consolidation, the S&P 500 broke out to the upside in September 2010, with a confirmation from volume, particularly when analyzed using the additional conditions we have provided. There was a breakout under similar volume conditions in December 2010 after a shorter consolidation period during the overall bullish trend.
Bloomberg code for color-based system:

using System;
using System.Collections.Generic;
using System.Text;
using System.Drawing;
using Bloomberg.Study.API;
using Bloomberg.Study.CoreAPI;
using Bloomberg.Study.Util;
using Bloomberg.Study.TA;
using Bloomberg.Math;

namespace Color_Volume_Bars
{

    public partial class ColorVolumeBars
    {
        // The author specifies a 2 week look back (10 bars).
 // Instead we have created a user definable input parameter
        public StudyIntegerProperty Period = new StudyIntegerProperty(10);

        private void Initialize()
        {
            // A Study Panel is added below the price panel for the Volume
            Panels.Add("VolumePanel", new StudyPanel());

            Output.Add("VolumeData", new TimeSeries());
            StudyLine volumeLine = new StudyLine("VolumeData");
            volumeLine.Style = LineStyle.Histogram;
            Panels["VolumePanel"].Visuals.Add("VolumeData", volumeLine);

// PaintBar marker is used in the Study Panel on Volume data as it would be on Price data
            Output.Add("PaintGreen", new TimeSeries());
            StudySignal pntGreen = new StudySignal("PaintGreen");
            pntGreen.Marker = new PaintBar(Color.Green);
            Panels["VolumePanel"].Visuals.Add("PaintGreen", pntGreen);

            Output.Add("PaintBlue", new TimeSeries());
            StudySignal pntBlue = new StudySignal("PaintBlue");
            pntBlue.Marker = new PaintBar(Color.Blue);
            Panels["VolumePanel"].Visuals.Add("PaintBlue", pntBlue);

            Output.Add("PaintOrange", new TimeSeries());
            StudySignal pntOrange = new StudySignal("PaintOrange");
            pntOrange.Marker = new PaintBar(Color.Orange);
            Panels["VolumePanel"].Visuals.Add("PaintOrange", pntOrange);

            Output.Add("PaintRed", new TimeSeries());
            StudySignal pntRed = new StudySignal("PaintRed");
            pntRed.Marker = new PaintBar(Color.Red);
            Panels["VolumePanel"].Visuals.Add("PaintRed", pntRed);

            // This adds a data field 'Volume'
            // Other Bloomberg data fields can similarly be added
            DataField volumeData = new DataField("PX_VOLUME");
            Input.Add("Volume", volumeData);
        }


        public override void Calculate()
        {
            TimeSeries close = Input.Close;
            TimeSeries volume = Input["Volume"];
            TimeSeries closesago = close.ShiftRight(Period.Value);
            TimeSeries volumeago = volume.ShiftRight(Period.Value);

            TimeSeries Green = new TimeSeries((close > closesago).And(volume > volumeago));
            TimeSeries Blue = new TimeSeries((close > closesago).And(volume < volumeago));
            TimeSeries Orange = new TimeSeries((close < closesago).And(volume < volumeago));
            TimeSeries Red = new TimeSeries((close < closesago).And(volume > volumeago));

            Output.Update("VolumeData", volume);
            Output.Update("PaintGreen", Green);
            Output.Update("PaintBlue", Blue);
            Output.Update("PaintOrange", Orange);
            Output.Update("PaintRed", Red);
        }

    }

}

AMIBROKER: COLOR-BASED SYSTEM
In “A Color-Based System For Short-Term Trading” in this issue, author Edgar Kraut presents a simple system based on the 10-day momentum of price and volume. The relationship between price and volume now and 10 days ago is used to assign colors to volume bars.
The color-coded volume chart, color-coded spreadsheet, and trading system can be easily implemented using AmiBroker Formula Language (Afl). A ready-to-use formula is shown here. To use it, enter the formula in the Afl Editor and then press “Insert Indicator,” or go to the Tools→Exploration menu to get a color-coded spreadsheet, or the Tools→Backtest menu if you want to test the system.
It is worth noting that the high percentage of profitability in this system could be because a one-bar delay was not applied to the trailing stop. Once the more realistic one-bar delay is applied, the profitability drops significantly.
A sample chart is shown in Figure 4.
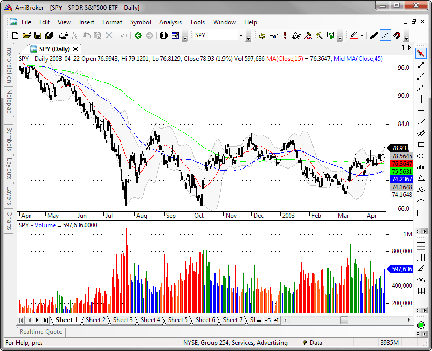
FIGURE 4: AMIBROKER, COLOR-BASED SYSTEM. Here is a daily price chart of SPY (upper pane) with the color-coded volume chart (lower pane).
AmiBroker code for Kraut’s color-based trading system:

// color chart code
Range = 10;
P2 = C;
V2 = V;
P1 = Ref( C, -Range );
V1 = Ref( V, -Range );

Color = IIf( P2 > P1 AND V2 > V1, colorGreen,
        IIf( P2 > P1 AND V2 < V1, colorBlue,
        IIf( P2 < P1 AND V2 < V1, colorOrange,
        /*else*/ colorRed ) ) );

Plot( Volume, "Volume", Color, styleHistogram | styleThick );

// color exploration code
Filter = BarIndex() > Range;
AddColumn( P2, "P2" );
AddColumn( V2, "Vol2", 1.0 );
AddColumn( Ref( DateTime(), -Range ), "Date P1", formatDateTime );
AddColumn( P1, "P1" );
AddColumn( V1, "Vol1", 1.0 );
AddColumn( 100 * (P2-P1)/P1, "Price delta%" );
AddColumn( 100 * (V2-V1)/V1, "Vol delta%" );
AddTextColumn( "", "V2 Color", 0, colorDefault, Color );

// system code
SetTradeDelays( 1, 1, 1, 1 ); // realistic delays
SetOption("ActivateStopsImmediately", True );
BuyPrice = Open;
SellPrice = Open;
Buy = Color == colorGreen OR Color == colorBlue;
Sell = False; // only use stops for exit
ApplyStop( stopTypeTrailing, stopModePercent, 1 );

eSIGNAL: COLOR-BASED SYSTEM
For this month’s Traders’ Tip, we’ve provided the formulas Kraut_ColoredBars.efs, Kraut_ColoredBarsInd.efs, and Kraut_ColoredBarsIndWL.efs, based on Edgar Kraut’s article in this issue, “A Color-Based System For Short-Term Trading.”
All studies contain a formula parameter to set the lookback periods, which may be configured through the “Edit Chart” window. The Kraut_ColoredBars.efs formula displays the price chart (Figure 5) and allows backtesting. This study also contains one additional formula parameter to set the trailing percent. The Kraut_ColoredBarsInd.efs formula displays the histogram indicator. The watchlist study — Kraut_ColoredBarsIndWL.efs (see Figure 6) — displays all the values and columns from the Excel example given in Kraut’s article.
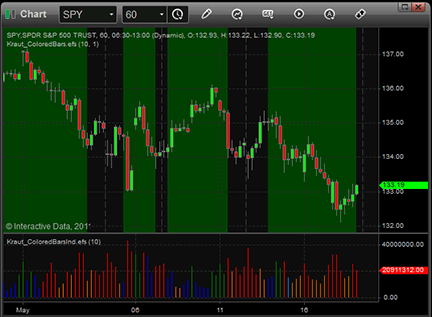
Figure 5: eSIGNAL, Color-Based System
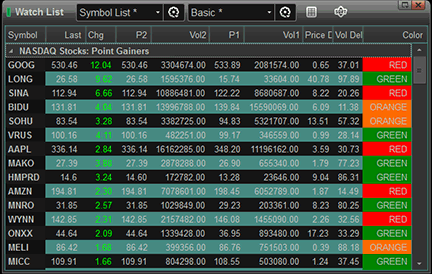
Figure 6: eSIGNAL, WATCHLIST
To discuss these studies or download complete copies of the formulas, visit the Efs Library Discussion Board forum under the Forums link from the support menu at www.esignal.com or visit our Efs KnowledgeBase at www.esignal.com/support/kb/efs/. The eSignal formula scripts (Efs) are also shown here.
Kraut_ColoredBars.efs

/*********************************
Provided By:
    Interactive Data Corporation (Copyright © 2010)
    All rights reserved. This sample eSignal Formula Script (EFS)
    is for educational purposes only. Interactive Data Corporation
    reserves the right to modify and overwrite this EFS file with
    each new release.

Description:
    A Color-Based System For Short-Term Trading For WL

Version:            1.0  16/05/2011
Formula Parameters:                     Default:
Lookback                                10
Trailing Percent                        1
Notes:
    The related article is copyrighted material. If you are not
    a subscriber of Stocks & Commodities, please visit www.traders.com.
**********************************/
var fpArray = new Array();
var bVersion = null;
function preMain()
{
    setPriceStudy(true);

    var x=0;
    fpArray[x] = new FunctionParameter("gLookBack", FunctionParameter.NUMBER);
    with(fpArray[x++])
    {
	setName("Lookback");
	setLowerLimit(1);
        setDefault(10);
    }
    fpArray[x] = new FunctionParameter("gTrailing", FunctionParameter.NUMBER);
    with(fpArray[x++])
    {
	setName("Trailing Percent");
	setLowerLimit(1);
	setUpperLimit(100);
        setDefault(1);
    }
}
var bInit = false;
var xVol = null;
var xCls = null;
var xDay = null;
var xMonth = null;
var xYear = null;
var stop = 0;
function main(gLookBack, gTrailing)
{
    if (bVersion == null) bVersion = verify();
    if (bVersion == false) return;
    if  ( getCurrentBarIndex() == 0 ) return ;

    if (!bInit)
    {
        xCls = close();
        xVol = volume();
        bInit = true;
    }

    var vCls = xCls.getValue(0);
    var vVol = xVol.getValue(0);
    var vCls1 = xCls.getValue(-1);
    var vClsPrev = xCls.getValue(-gLookBack);
    var vVolPrev = xVol.getValue(-gLookBack);
    if ( vClsPrev == null ) return;
    var cond = 0;
    if ( vCls >= vClsPrev && vVol >= vVolPrev )
    {
        setBarFgColor(Color.green);
        cond = 0;
    }
    if ( vCls >= vClsPrev && vVol <= vVolPrev )
    {
        setBarFgColor(Color.blue);
        cond = 1;
    }
    if ( vCls <= vClsPrev && vVol <= vVolPrev )
    {
        setBarFgColor(Color.RGB(255, 106, 0));
        cond = 2;
    };
    if ( vCls <= vClsPrev && vVol >= vVolPrev )
    {
        setBarFgColor(Color.red);
        cond = 3;
    };

    if ( Strategy.isLong() )
    {
            if ( vCls <= stop )
            {
                Strategy.doSell( "Close Long", Strategy.CLOSE, Strategy.THISBAR );
                stop = 0;
            }
            else
            {
                if (vCls > vCls1)  stop = vCls * (1- gTrailing / 100);
            }
    }
    else
    {
            if ( cond == 0 || cond == 1  )  Strategy.doLong("Entry Long", Strategy.CLOSE, Strategy.THISBAR);
    }

    if ( Strategy.isLong() ) setBarBgColor (Color.darkgreen);
}

function verify() {
    var b = false;
    if (getBuildNumber() < 779) {
        drawTextAbsolute(5, 35, "This study requires version 8.0 or later.",
            Color.white, Color.blue, Text.RELATIVETOBOTTOM|Text.RELATIVETOLEFT|Text.BOLD|Text.LEFT,
            null, 13, "error");
        drawTextAbsolute(5, 20, "Click HERE to upgrade.@URL=https://www.esignal.com/download/default.asp",
            Color.white, Color.blue, Text.RELATIVETOBOTTOM|Text.RELATIVETOLEFT|Text.BOLD|Text.LEFT,
            null, 13, "upgrade");
        return b;
    } else {
        b = true;
    }
    return b;
}


Kraut_ColoredBarsInd.efs

/*********************************
Provided By:
    Interactive Data Corporation (Copyright © 2010)
    All rights reserved. This sample eSignal Formula Script (EFS)
    is for educational purposes only. Interactive Data Corporation
    reserves the right to modify and overwrite this EFS file with
    each new release.

Description:
    A Color-Based Indicator For Short-Term Trading

Version:            1.0  16/05/2011

Formula Parameters:                     Default:
Lookback                                10


Notes:
    The related article is copyrighted material. If you are not
    a subscriber of Stocks & Commodities, please visit www.traders.com.

**********************************/

var fpArray = new Array();

var bVersion = null;

function preMain()

{

    setCursorLabelName("Price Zone Analyzer", 0);

    setPlotType(PLOTTYPE_HISTOGRAM,0);


    var x=0;
    fpArray[x] = new FunctionParameter("gLookBack", FunctionParameter.NUMBER);
    with(fpArray[x++])
    {
	setName("Lookback");
	setLowerLimit(1);
        setDefault(10);
    }

}


var bInit = false;
var xVol = null;
var xCls = null;
function main(gLookBack)
{
    if (bVersion == null) bVersion = verify();
    if (bVersion == false) return;

    if (!bInit)
    {
        xCls = close();
        xVol = volume();
        bInit = true;
    }
    var vCls = xCls.getValue(0);
    var vVol = xVol.getValue(0);
    var vClsPrev = xCls.getValue(-gLookBack);
    var vVolPrev = xVol.getValue(-gLookBack);
    if ( vClsPrev == null ) return;

    if ( vCls > vClsPrev && vVol > vVolPrev ) setBarFgColor(Color.green);
    if ( vCls > vClsPrev && vVol < vVolPrev ) setBarFgColor(Color.blue);
    if ( vCls < vClsPrev && vVol < vVolPrev ) setBarFgColor(Color.RGB(255, 106, 0));
    if ( vCls < vClsPrev && vVol > vVolPrev ) setBarFgColor(Color.red);

    return vVol;
}
function verify() {
    var b = false;
    if (getBuildNumber() < 779) {
        drawTextAbsolute(5, 35, "This study requires version 8.0 or later.",
            Color.white, Color.blue, Text.RELATIVETOBOTTOM|Text.RELATIVETOLEFT|Text.BOLD|Text.LEFT,
            null, 13, "error");
        drawTextAbsolute(5, 20, "Click HERE to upgrade.@URL=https://www.esignal.com/download/default.asp",
            Color.white, Color.blue, Text.RELATIVETOBOTTOM|Text.RELATIVETOLEFT|Text.BOLD|Text.LEFT,
            null, 13, "upgrade");
        return b;
    } else {
        b = true;
    }
    return b;
}


Kraut_ColoredBarsIndWL.efs

/*********************************
Provided By:
    Interactive Data Corporation (Copyright © 2010)
    All rights reserved. This sample eSignal Formula Script (EFS)
    is for educational purposes only. Interactive Data Corporation
    reserves the right to modify and overwrite this EFS file with
    each new release.

Description:
    A Color-Based System For Short-Term Trading For WL

Version:            1.0  16/05/2011
Formula Parameters:                     Default:
Lookback                                10
Notes:
    The related article is copyrighted material. If you are not
    a subscriber of Stocks & Commodities, please visit www.traders.com.
**********************************/
var fpArray = new Array();
var bVersion = null;
function preMain()
{
    setCursorLabelName("Date P2", 0);
    setCursorLabelName("P2", 1);
    setCursorLabelName("Vol2", 2);
    setCursorLabelName("Date P1", 3);
    setCursorLabelName("P1", 4);
    setCursorLabelName("Vol1", 5);
    setCursorLabelName("Price Delta, %", 6);
    setCursorLabelName("Vol Delta, %", 7);
    setCursorLabelName("Color", 8);


    var x=0;
    fpArray[x] = new FunctionParameter("gLookback", FunctionParameter.NUMBER);
    with(fpArray[x++])
    {
	setName("Lookback");
	setLowerLimit(1);
        setDefault(10);
    }
}
var bInit = false;
var xVol = null;
var xCls = null;
var xDay = null;
var xMonth = null;
var xYear = null;
function main(gLookback)
{
    if (bVersion == null) bVersion = verify();
    if (bVersion == false) return;
    if (!bInit)
    {
        xCls = close();
        xVol = volume();
        xDay = day();
        xMonth = month();
        xYear = year();

        bInit = true;
    }

    var vCls = xCls.getValue(0);
    var vVol = xVol.getValue(0);
    var vClsPrev = xCls.getValue(-gLookback);
    var vVolPrev = xVol.getValue(-gLookback);
    if ( vClsPrev == null ) return;
    var vP2Day = ""+xMonth.getValue(0)+"/"+xDay.getValue(0)+"/"+xYear.getValue(0);
    var vP1Day = ""+xMonth.getValue(-gLookback)+"/"+xDay.getValue(-gLookback)+"/"+xYear.getValue(-gLookback);
    var vPriceDelta = 100 * Math.abs( vCls - vClsPrev ) / vCls;
    var vVolDelta = 100 * Math.abs ( vVol - vVolPrev ) / vVol;
    var vColor = "na";
    if ( vCls >= vClsPrev && vVol >= vVolPrev )
    {
        setBarBgColor(Color.green,8);
        vColor = "GREEN"
    };
    if ( vCls >= vClsPrev && vVol <= vVolPrev )
    {
        setBarBgColor(Color.blue, 8);
        vColor = "BLUE"
    };
    if ( vCls <= vClsPrev && vVol <= vVolPrev )
    {
        setBarBgColor(Color.RGB(255, 106, 0), 8);
        vColor = "ORANGE"
    };
    if ( vCls <= vClsPrev && vVol >= vVolPrev )
    {
        setBarBgColor(Color.red,8);
        vColor = "RED"
    };

    return new Array (vP2Day, vCls, vVol, vP1Day, vClsPrev, vVolPrev, vPriceDelta, vVolDelta, vColor);

}
function verify() {
    var b = false;
    if (getBuildNumber() < 779) {
        drawTextAbsolute(5, 35, "This study requires version 8.0 or later.",
            Color.white, Color.blue, Text.RELATIVETOBOTTOM|Text.RELATIVETOLEFT|Text.BOLD|Text.LEFT,
            null, 13, "error");
        drawTextAbsolute(5, 20, "Click HERE to upgrade.@URL=https://www.esignal.com/download/default.asp",
            Color.white, Color.blue, Text.RELATIVETOBOTTOM|Text.RELATIVETOLEFT|Text.BOLD|Text.LEFT,
            null, 13, "upgrade");
        return b;
    } else {
        b = true;
    }
    return b;
}

THINKORSWIM.COM: COLOR-BASED SYSTEM
Edgar Kraut’s article in this issue, “A Color-Based System For Short-Term Trading,” outlines the use of a volume coloring system that can be used to support a swing-trading system. The system compares the volume and closing price of a given day versus their values two weeks ago to generate four different types of color signals on the volume.
We have prepared two strategy files and one chart study file written in our proprietary language, thinkScript. The entry strategy is based on the color system that Kraut outlines in his article; the exit is based on the 1% trailing stop he recommends. The study file outlines the coloring of the volume bars themselves.
The code is shown here along with instructions for applying it.
- From our TOS Charts, Select Studies → Edit Studies
- Select the “Strategies” tab in the upper left hand corner.
- Select “New” in the lower left hand corner.
- Name the Long Entry (i.e. SpectrumBarsLE)
- Click in the script editor window, remove “declare LONG_ENTRY” and paste the following:
declare LONG_ENTRY;
input length = 10;
addOrder(close > close[length] and IsNaN(entryPrice()));
SetColor(GetColor(1));
- Select OK.
- Select “New” in the lower left hand corner.
- Name the Short Entry (i.e. TrailingStopLX)
- Click in the script editor window, remove “declare LONG_ENTRY” and paste the following:
declare LONG_EXIT; input trailStop = 1.0; input offsetType = {default percent, value, tick}; def entryPrice = entryPrice(); rec price = if IsNaN(entryPrice[1]) then entryPrice else Max(high, price[1]); def mult; switch (offsetType) { case percent: mult = price / 100; case value: mult = 1; case tick: mult = tickSize(); } def trailStopPrice = price - trailStop * mult; addOrder(low <= trailStopPrice); - Select OK.
- (Optional) If you wish to add the colored volue bars, click Studies at the upper-left hand corner of the “Edit Studies and Strategies” window.
- Select “New” in the lower left hand corner.
- Name the oscillator study (i.e. SpectrumBars)
- Click in the script editor window, remove "plot Data = close;" and paste the following:
declare lower; declare zerobase; input length = 10; input paintBars = no; def isGreen = close > close[length] and volume > volume[length]; def isBlue = close > close[length] and volume < volume[length]; def isOrange = close < close[length] and volume < volume[length]; def isRed = close < close[length] and volume > volume[length]; plot Vol = volume; Vol.SetPaintingStrategy(PaintingStrategy.HISTOGRAM); Vol.SetLineWeight(3); Vol.DefineColor("Green", Color.GREEN); Vol.DefineColor("Blue", Color.BLUE); Vol.DefineColor("Orange", Color.ORANGE); Vol.DefineColor("Red", Color.RED); Vol.AssignValueColor(if isGreen then Vol.color("Green") else if isBlue then Vol.color("Blue") else if isOrange then Vol.color("Orange") else if isRed then Vol.color("Red") else Color.LIGHT_GRAY); DefineGlobalColor("Green", Color.GREEN); DefineGlobalColor("Blue", Color.BLUE); DefineGlobalColor("Orange", Color.ORANGE); DefineGlobalColor("Red", Color.RED); AssignPriceColor(if !paintBars then Color.CURRENT else if isGreen then globalColor("Green") else if isBlue then globalColor("Blue") else if isOrange then globalColor("Orange") else if isRed then globalColor("Red") else Color.LIGHT_GRAY); - Select OK.
- Note: If you have added the SpectrumBars study along with the strategies, you may want to turn off the standard volume display, as its data will be duplicated with the new study.
A sample chart is shown in Figure 7.
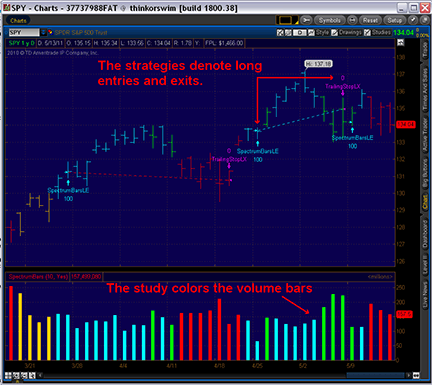
Figure 7: THINKORSWIM, Color-Based System

WEALTH-LAB: COLOR-BASED SYSTEM
In his article in this issue, author Edgar Kraut presents a simple system that consists of two rules for taking long positions. Formally, it does not share traits of classic swing-trading systems (as the author states in the article) except for its sensitive 1% trailing stop, so with its trend condition rule and a volume confirmation rule seeking to identify and hold a rising stock for a short period of time, we would rather classify it as pure momentum trading.
Our C# version of the system allows Wealth-Lab 6 users to easily change the lookback and exit parameters by dragging the parameter sliders in the lower-left corner of Wealth-Lab’s main workspace. We replaced the default trailing exit with a combination of a profit target and a stop-loss, and made the system exit on red and orange bars. For traders willing to tweak the rules further, here’s a very simple trend-identification idea of the same kind to go along with the volume confirmation rule:
- Bullish trend starts after x consecutive closes above the trailing close from y days ago,
- Bearish trend starts after x consecutive closes below the trailing close from y days ago.
C# Code:

using System;
using System.Collections.Generic;
using System.Text;
using System.Drawing;
using WealthLab;
using WealthLab.Indicators;

namespace WealthLab.Strategies
{
	public class ColorBased : WealthScript
	{
		private StrategyParameter paramLookback;
		private StrategyParameter paramSL;
		private StrategyParameter paramPT;

		public ColorBased()
		{
			paramLookback = CreateParameter("Lookback", 20, 2, 100, 1);
			paramSL = CreateParameter("Stop %", 4, 1, 10, 1);
			paramPT = CreateParameter("Target %", 4, 1, 20, 1);
		}

		private Color color( int bar, int lookback )
		{
			Color c = Color.Transparent;

			if( Bars.Count > lookback )
			{
				int b = bar-lookback;

				bool green = (Close[bar] > Close[b]) && (Volume[bar] > Volume[b]);
				bool blue = (Close[bar] > Close[b]) && (Volume[bar] <= Volume[b]);
				bool orange = (Close[bar] < Close[b]) && (Volume[bar] < Volume[b]);
				bool red = (Close[bar] < Close[b]) && (Volume[bar] >= Volume[b]);

				if( green ) c = Color.Green;
				if( blue ) c = Color.Blue;
				if( orange ) c = Color.Orange;
				if( red ) c = Color.Red;
			}

			return c;
		}

		protected override void Execute()
		{
			int lookback = paramLookback.ValueInt;
			double SL = paramSL.Value;
			double PT = paramPT.Value;

			for(int bar = lookback; bar < Bars.Count; bar++)
			{
				Color c = color(bar,lookback);
				SetSeriesBarColor( bar, Volume, c );
				SetBarColor( bar, c );

				if (IsLastPositionActive)
				{
					Position p = LastPosition;
					double Stop = p.EntryPrice * (1 - SL / 100.0d);
					double Target = p.EntryPrice * (1 + PT / 100.0d);

					if( c == Color.Red || c == Color.Orange )
						SellAtMarket(bar+1, p, c.ToString() );
					else
						if( !SellAtStop(bar + 1, p, Stop, "SL") )
						SellAtLimit(bar + 1, p, Target, "TP");
				}
				else
				{
					if( c == Color.Green || c == Color.Blue )
						BuyAtMarket( bar+1, c.ToString() );
				}
			}
		}
	}
}
A sample chart is shown in Figure 8.
Dowload the code as a downloadable file here: WealthLab_ColorBasedSystem_July2011.odt
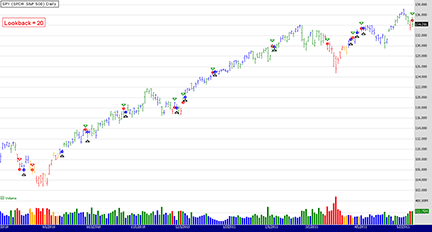
Figure 8: WEALTH-LAB, Color-Based System. This sample Wealth-Lab Developer 6.2 chart shows the color-based system applied to a daily chart of SPDR S&P 500 (SPY).

WORDEN BROTHERS TC2000: SCANNING FOR SHORT-TERM TRADES
In his article “A Color-Based System For Short-Term Trading” in this issue, author Edgar Kraut discusses a trading strategy that compares price and volume to a previous point in time. Broken down to its simplest form, if price and volume are both higher than x bars ago, then enter a long trade with a 1% trailing stop.
In TC2000, you can scan for this setup using a Personal Criteria Formula (Pcf). Once you create a Pcf, you can use it as a condition in an EasyScan, as a column in the watchlist, and even plot the Pcf on the chart as an indicator.
In Figure 9, we show an EasyScan we’ve named “SC Traders Tips July 2011” with a single condition, a Pcf created using the formula (C>C10 and V>V10). At the time the scan was run, 33 stocks in the Russell 3000 passed the scan and these stocks appear in the watchlist on the left. You can change the formula to include stocks where price is up but volume is not (the “blue” volume bars discussed in the article) by using the following formula: (C>C10). You don’t need to test for volume at all if you want to include stocks where volume is up or down from 10 bars ago.
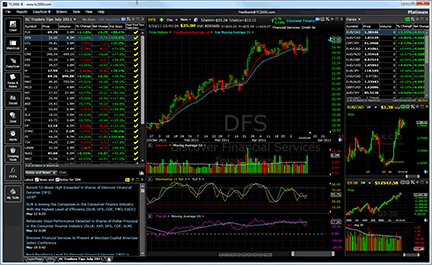
Figure 9: TC2000, Color-Based System. Here, the new TC2000 version 11 displays real-time scan results of stocks passing the green or blue volume bar setup conditions.
You can see stocks in other lists that are passing the setup condition by adding the Pcf as a column, as we’ve done in Figure 9. The column with the yellow checkmarks indicates symbols that are currently passing the setup conditions. In this example, they’re all checked because we’ve already filtered out stocks not passing with the EasyScan, but you get the idea. On any other list, such as the S&P 500, Russell 1000, and so on, you can add this Pcf as a column and then sort the column to see symbols passing the setup conditions (Figure 9).
For more information on TC2000 or to start a free trial, visit www.TC2000.com. You can also access your watchlists, scans, and chart template while away from your computer using the new TC2000 Mobile app (www.TC2000.com/Mobile).

AIQ: COLOR-BASED SYSTEM
Here is the Aiq code based on Edgar Kraut’s article in this issue, “A Color-Based System For Short-Term Trading.” The code is also provided at the websites noted below. I coded the color indicators and three systems that use the indicators. Two of the three systems are discussed here.
I ran backtests using the Aiq Portfolio Manager module from 1/1/1998 to 5/13/2011 trading the Nasdaq 100 list of stocks. In Figure 10, I show the test results of simulated trading using the system that was proposed in Kraut’s article for trading the Spy with the following capitalization parameters:
- Maximum positions per day = 3
- Maximum total positions allowed = 10
- Choose candidates using highest volume on the day of the signal
- Size each position at 10% of total account equity recomputed every day.
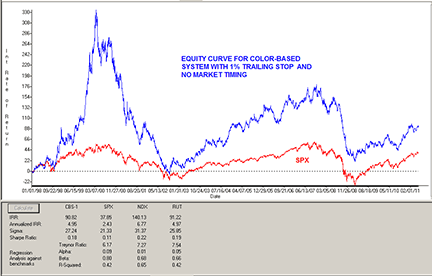
Figure 10: AIQ SYSTEMS, Kraut’s Color-Based System. Here is a sample equity curve for Edgar Kraut’s system trading the NASDAQ 100 list of stocks compared to the S&P 500 index over the test period 1/1/98 to 5/13/11. This original system uses a 1% trailing stop as the only exit.
For the test period, the original system using the 1% trailing stop as the only exit showed an average annual return of 4.95% with a maximum drawdown of 78.52% on 10/9/2002.
Since the drawdown of 78.52% on the original system was more than most traders could tolerate, I added trend and market trend filters and also changed the buy rules and exit rules as follows:
- Buy if there is a green or blue bar today and if yesterday there were six consecutive bars of orange or red color and the 200-bar simple moving average of both the stock and the S&P 500 index are higher than they were 10 bars ago.
- Exit if there are four consecutive bars of orange or red.
All trades for both systems are executed at the next open after a trade signal occurs. A commission of $0.01 per share round-turn was used. The same capitalization parameters were used in testing both the modified system and the original system.
In Figure 11, I show the test results of simulated trading on the Nasdaq 100 list of stocks using this modified system. For the test period, this modified system showed an average annual return of 20.24% with a maximum drawdown of 31.55% on 5/25/2000.
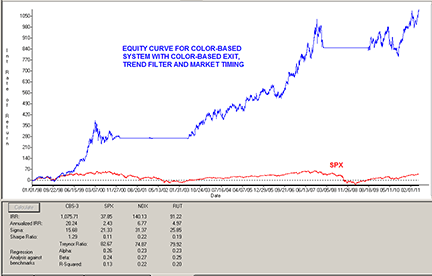
Figure 11: AIQ SYSTEMS, MODIFIED System equity curve. Here is a sample equity curve for my modified system trading the NASDAQ 100 list of stocks over the test period 1/1/98 to 5/31/11 compared to the S&P 500 index.
In Figure 12, I show the color-based indicators applied to both the price and volume on a chart of Adsk. The arrows on the chart also show a sample trade from the modified system.
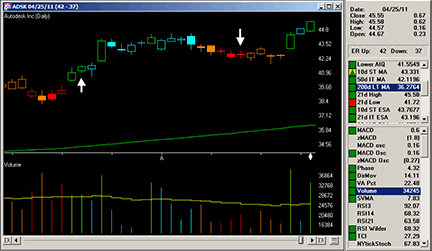
Figure 12: AIQ SYSTEMS, MODIFIED System example. Shown here is a chart of ADSK with color studies and arrows showing sample trades from the modified system.
The code and Eds file can be downloaded from www.TradersEdgeSystems.com/traderstips.htm.
AIQ code:

! A COLOR-BASED SYSTEM FOR SHORT-TERM TRADING
! Author: Edgar Kraut, TASC July 2011
! Coded by: Richard Denning 5/14/11
! www.TradersEdgeSystems.com

! ABBREVIATIONS:
C is [close].
C10 is valresult(C,10).
V is [volume].
V10 is valresult(V,10).

! FOR COLOR BARS:
Green if C > C10 and V > V10.
Blue if C > C10 and V < V10.
Orange if C < C10 and V < V10.
Red if C < C10 and V > V10.

! FOR UDF IN REPORT COLUMN:
Signal is iff(Green,"Green",iff(Blue,"Blue",
	iff(Orange,"Orange",iff(Red,"Red","")))).

! TRADING SYSTEMS:
! ORIGINAL SYSTEM:
Buy if (Green or Blue) .
! Use built-in trailing stop set to 99 for exits

! FIRST MODIFICATION (NOT USED):
Buy2 if (Green or Blue)
	and countof((Red or Orange),6,1)=6.

! SECOND MODIFICATION (FINAL SYSTEM):
SMA is simpleavg(C,200).
SPXsma is TickerUDF("SPX",SMA).
Buy3 if (Green or Blue)
	and countof((Red or Orange),6,1)=6
	and SMA > valresult(SMA,10)
	and SPXsma > valresult(SPXsma,10).

Sell2 if countof((Red or Orange),4)=4.

TRADERSSTUDIO: COLOR-BASED SYSTEM
I have coded three systems that use the color-based rules presented in Edgar Kraut’s article in this issue, “A Color-Based System For Short-Term Trading.” The last input to the system determines which of the three systems is run. An explanation of the system parameters is shown in the table in Figure 13.
sysType = 0: System that was defined in the article with the 1% trailing stop.
sysType = 1: Added rule that requires a certain number of orange or red bars to occur before the green or blue bar plus a rule that requires the stock’s trend to be up (such that the 200-bar simple moving average of the stock is higher than it was a certain number of bars ago); exit if there are a certain number of red or orange bars in a row.
sysType = 2: Same rules as sysTypes 0 and 1 plus a rule that requires the trend to be up on the S&P 500 index.
| Parameter | Default | What it does | Applies to System# |
|---|---|---|---|
| len1 | 15 | Lookback length in bars for color rules | 0,1,2 |
| maLen | 200 | Simple moving average length for trend determination | 1,2 |
| trailStopPct | 1 | Percentage value for trailing stop | 0 |
| entryRObars | 1 | Count of red or orange bars in a row (minimum) for entry | 1,2 |
| exitRObars | 6 | Count of red or orange bars in a row (minimum) for exit | 1,2 |
| sysType | 2 | Chooses which of three systems to run | 0 or 1 or 2 |
Figure 13: Tradersstudio, parameters
I tested the above systems on the following Etf portfolio: Dia, Iwm, Mdy, and Spy. In testing sysTypes 0 and 1, I found that they had too much drawdown for my taste. Consequently, I focused on sysType 2 by running robustness tests using the TradersStudio optimizer and 3D parameter maps (see Figure 14). The system appears robust, as all of the parameter sets showed a profit and there are no sharp spikes on the maps. The “len1” parameter was the most sensitive, with a peak value of 16 with falloff on either side.
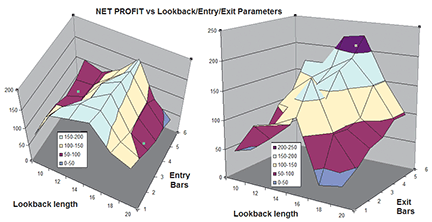
Figure 14: TRADERSSTUDIO, color-based system, system 2. This shows the three-dimensional parameter maps for sysType 2 trading one share each of the ETF portfolio.
After examining the parameter map, I chose a parameter set of (15,200,1,1,6,2) and ran a backtest using the Tradeplan module from 4/1/94 to 5/13/11 choosing the “TS_StockTradingPlanSimple” tradeplan script that ships with the product. This tradeplan divides the capital into four equal dollar pieces so that all signals could be taken. In Figure 15, I show the Tradeplan equity curve and in Figure 16, I show the Tradeplan underwater equity curve. Most of the drawdowns are limited to about 9%. For the test period, the compound annual return was 3.79% with a maximum drawdown of 11.88% on 7/6/2010.
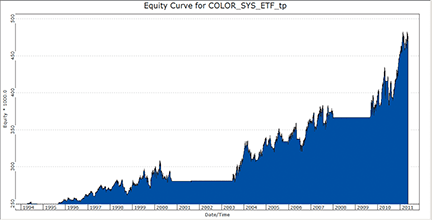
Figure 15: TRADERSSTUDIO, system 2 equity curve. Here is the Tradeplan equity curve for sysType 2 using equal equity sizing, trading all signals from the ETF portfolio.
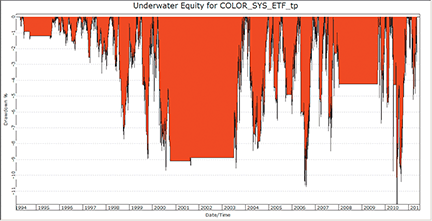
Figure 16: TRADERSSTUDIO, UNDERWATER EQUITY CURVE FOR SYSTEM 2. Here is the Tradeplan underwater equity curve for sysType 2 using equal equity sizing, trading all signals from the ETF portfolio.
The TradersStudio code for this system can be downloaded from the TradersStudio website at www.TradersStudio.com → Traders Resources → FreeCode or www.TradersEdgeSystems.com/traderstips.htm. The code is also shown here.
TradersStudio code:

' A COLOR-BASED SYSTEM FOR SHORT-TERM TRADING
' Author: Edgar Kraut, TASC July 2011
' Coded by: Richard Denning 5/15/11
' www.TradersEdgeSystems.com

Sub COLOR_SYS(len1,maLen,trailStopPct,entryRObars,exitRObars,sysType)
'defaults len1=15,maLen=200,trailStopPct=1,entryRObars=1,exitRObars=6,sysType=2
Dim Green As BarArray
Dim Blue As BarArray
Dim Orange As BarArray
Dim Red As BarArray
Dim SMA As BarArray
Dim SPXsma As BarArray

' COLOR RULES:
Green = C > C[len1] And V > V[len1]
Blue = C > C[len1] And V < V[len1]
Orange = C < C[len1] And V < V[len1]
Red = C < C[len1] And V > V[len1]

' TRADING SYSTEMS:
If sysType=0 And (Green Or Blue) Then Buy("LE",1,0,Market,Day)
If C < Highest(C,BarsSinceEntry) * (1 - trailStopPct/100) Then ExitLong("LX","LE",1,0,Market,Day)
' If BarsSinceEntry > 17 Then ExitLong("LXtime","LE",1,0,Market,Day)

If sysType=1 And (Green Or Blue) And countof((Red Or Orange),entryRObars,1)=entryRObars Then Buy("LE1",1,0,Market,Day)
If countof((Red Or Orange),exitRObars,0)=exitRObars Then ExitLong("LX1","LE1",1,0,Market,Day)

SMA = Average(C,maLen)
SPXsma = Average(C Of independent1,maLen)
If sysType=2 And (Green Or Blue) And countof((Red Or Orange),entryRObars,1)=entryRObars And SMA > SMA[len1] And SPXsma > SPXsma[len1] And TSCLose > 10 Then
    Buy("LE2",1,0,Market,Day)
End If
If countof((Red Or Orange),exitRObars,0)=exitRObars Then ExitLong("LX2","LE2",1,0,Market,Day)
End Sub

STRATASEARCH: COLOR-BASED SYSTEM
When we first read “A Color-Based System For Short-Term Trading” by Edgar Kraut, our initial thoughts were that the author had found the holy grail. Nearly 98% of all long positions profitable since 2002? A minimum of 58% profit per year? A bust year of 2008 still gaining a profit of 220% on long positions? Even without commissions or spreads, these are some stellar results. So our goal was to not only provide this code to our users, but to confirm this incredible system performance.
In an attempt to duplicate the author’s tests, we created a system that entered long positions on blue or green bars, and sold based on a good-till-canceled trailing stop of 1%. But running this system against Spy from 2002 to 2010 didn’t produce anywhere near the stunning results for us. In fact, our tests produced only 35% profitable trades, with an average annual return of -3%. (See Figure 17.)
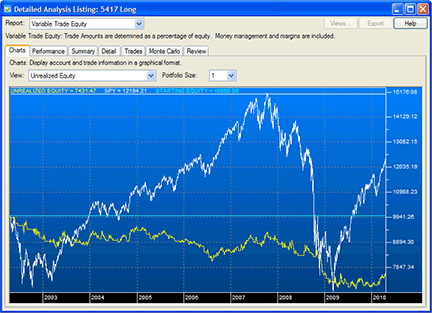
Figure 17: STRATASEARCH, COLOR-BASED SYSTEM. The equity performance of Kraut’s color-based system (in yellow) didn’t match the performance of buy and hold (white) in our tests.
Using the author’s intended platform of MetaStock, we were able to confirm the article’s results. However, it appears that the positive results can be largely attributed to MetaStock’s trailing stop, which automatically exits positions a small fraction away from the day’s high price. Some traders might question the ability to sell so close to the high price in actual trading, since the high price isn’t actually known until the trading day is over. But during a backtest, it certainly does create some stunning paper trades.
Despite not being the holy grail after all, the color-based indicators may still have some potential when used alongside the proper supporting trading rules. StrataSearch users can explore this further by downloading this month’s plugin from the Shared Area of the StrataSearch user forum and running an automated search for supporting rules.
//*********************************************************
// Colored Bars - Green
//*********************************************************
days = parameter("Days");
IsGreen = if(close > ref(close, -days) and
	volume > ref(volume, -days), 1, 0);

//*********************************************************
// Colored Bars - Blue
//*********************************************************
days = parameter("Days");
IsBlue = if(close > ref(close, -days) and
	volume <= ref(volume, -days), 1, 0);

//*********************************************************
// Colored Bars - Orange
//*********************************************************
days = parameter("Days");
IsOrange = if(close < ref(close, -days) and
	volume <= ref(volume, -days), 1, 0);

//*********************************************************
// Colored Bars - Red
//*********************************************************
days = parameter("Days");
IsRed = if(close < ref(close, -days) and
	volume > ref(volume, -days), 1, 0);

NEUROSHELL TRADER: COLOR-BASED SYSTEM
The color-based system for short-term trading as described by Edgar Kraut in his article in this issue can be easily implemented with a few of NeuroShell Trader’s 800+ indicators.
To show color-coded volume bars in NeuroShell Trader, simply select “New Indicator” from the Insert menu and use the Indicator Wizard to create the following indicators and to color each indicator appropriately:
Green:
IfThenElse( And2( A>B(Close, Lag(Close,10)), A>B(Volume, Lag(Volume,10)) ), Volume, * )

Blue:
IfThenElse( And2( A>B(Close, Lag(Close,10)), AB(Volume, Lag(Volume,10)) ), Volume, * )

Orange:
IfThenElse( And2( A<B(Close, Lag(Close,10)), A<B(Volume, Lag(Volume,10)) ), Volume, * )

Red:
IfThenElse( And2( A<B(Close, Lag(Close,10)), A>B(Volume, Lag(Volume,10)) ), Volume, * )
To recreate the color-based trading system, select “New Trading Strategy” from the Insert menu and enter the following formulas in the appropriate locations of the Trading Strategy Wizard:
Generate a buy long market order if ONE of the following is true:
And2( A>B(Close, Lag(Close,10)), A>B(Volume, Lag(Volume,10)) )
And2( A>B(Close, Lag(Close,10)), A<B(Volume, Lag(Volume,10)) )
Generate a long protective stop order:
TrailPrice%( Trading Strategy, 1 )
If you have NeuroShell Trader Professional, you can also choose whether the parameters should be optimized. After backtesting the trading strategy, use the “Detailed Analysis” button to view the backtest and trade-by-trade statistics for the strategy.
Users of NeuroShell Trader can go to the Stocks & Commodities section of the NeuroShell Trader free technical support website to download a copy of this or any previous Traders’ Tips.
A sample chart is shown in Figure 18.
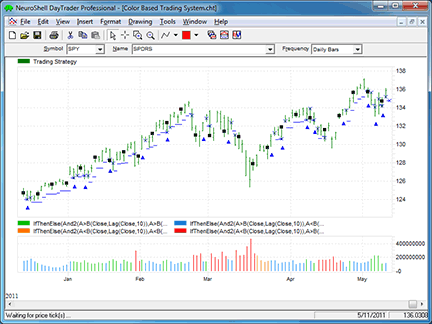
Figure 18: NEUROSHELL TRADER, Color-Based System. Here is a sample NeuroShell Trader chart showing the color-based volume and short-term trading system as described by Edgar Kraut in his article in this issue.

NINJATRADER: COLOR-BASED SYSTEM
We have implemented VolumeColors and VolumeColorsStrategy as an automated strategy and indicator based on Edgar Kraut’s article in this issue, “A Color-Based System For Short-Term Trading.” The indicator and strategy are available for download from www.ninjatrader.com/SC/July2011SC.zip.
Once they have been downloaded, from within the NinjaTrader Control Center window, select the menu File → Utilities → Import NinjaScript and select the downloaded file. This file is for NinjaTrader version 7 or greater.
You can review the strategy source code by selecting the menu Tools → Edit NinjaScript → Strategy from within the NinjaTrader Control Center window and selecting “VolumeColorsStrategy.”
You can review the indicator source code by selecting the menu Tools → Edit NinjaScript → Indicator from within the NinjaTrader Control Center window and selecting “VolumeColors.”
NinjaScript uses compiled Dlls that run native, not interpreted, which provides you with the highest performance possible.
A sample chart implementing the strategy is shown in Figure 19.
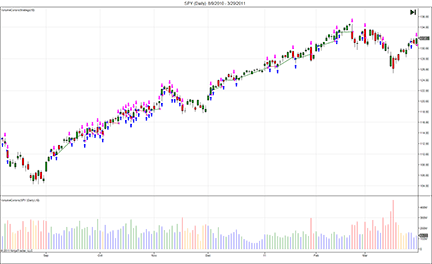
Figure 19: NINJATRADER, Color-Based System. This screenshot shows the VolumeColorsStrategy and related indicator applied to a daily chart of the SPDR ETF (SPY).

UPDATA: COLOR-BASED SYSTEM
This is based on the article by Edgar Kraut in this issue, “A Color-Based System For Short-Term Trading.”
The author has developed a swing-trading system based on price and volume momentum to trade the S&P 500 Etf, the Spdr. Care needs to be taken in factoring in the expense ratio to any Etf strategy, as well as any tracking error when Etfs are used for hedging purposes.
The Updata code for this concept in both indicator and system form has been added to the Updata Library and may be downloaded by clicking the Custom menu and then either “Indicator” or “System Library.” Those who cannot access the library due to a firewall may paste the code shown here into the Updata Custom editor and save it.
PARAMETER "Lookback Period" #Period=10
DISPLAYSTYLE Line
PLOTSTYLE Histogram
INDICATORTYPE Chart
NAME "Rainbow Volume Bars(" #Period ")" ""
@Volume=0
@PrevVolume=0
@Price=0
@PrevPrice=0

For #CURDATE=#Period To #LASTDATE

   @Volume=Vol
   @PrevVolume=Hist(@Volume,#Period)
   @Price=Close
   @PrevPrice=Hist(@Price,#Period)

   If @Price>@PrevPrice AND @Volume>@PrevVolume
      'Green
      COLOR RGB(0,255,0)
   ElseIf @Price>@PrevPrice AND @Volume<@PrevVolume
      'Blue
      COLOR RGB(0,0,255)
   ElseIf @Price<@PrevPrice AND @Volume>@PrevVolume
      'Red
      COLOR RGB(255,0,0)
   ElseIf @Price<@PrevPrice AND @Volume<@PrevVolume
      'Orange
      COLOR RGB(20,240,120)
   EndIf

   @Plot=@Volume

Next
A sample chart is shown in Figure 20.
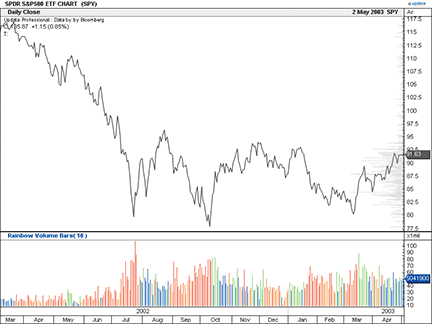
FIGURE 20: UPDATA, Color-Based System. This sample Updata chart shows the 10-period rainbow volume bars as applied to the S&P 500 ETF (SPDR).

TRADESIGNAL: COLOR-BASED SYSTEM
The strategy proposed by Edgar Kraut in his article in this issue, “A Color-Based System For Short-Term Trading” can be implemented using our online charting tool at www.tradesignalonline.com.
At the site, simply check the “Infopedia” section for our lexicon, where you will find the indicator and strategy. Click on it and select “Open script.” The indicator and/or strategy will be immediately available for you to apply to any chart you wish to. A sample is shown in Figure 21.
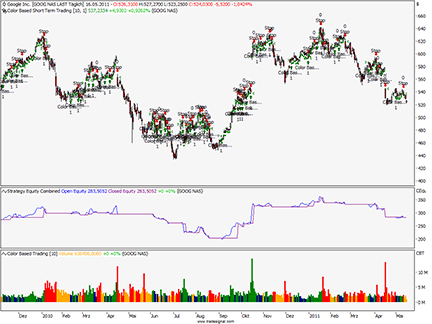
FIGURE 21: TRADESIGNAL ONLINE, COLOR-BASED STRATEGY. Here is a sample chart produced from Tradesignal Online with Edgar Kraut’s color-based indicator and strategy applied to a daily chart of Google, Inc.
TradeSignal code: Color Based Short Term Trading.eqs

Meta:
	Weblink ("https://www.tradesignalonline.com/lexicon/view.aspx?id=16905"),
	Synopsis("Long-only trading system, based on price and volume data from the 07/2011 issue of Stocks and Commodities."),
	Subchart( False );

Inputs:
	Period( 10 , 1 ),
	Percent_Stop( 1.0 );

Vars:
	greenBar, blueBar, orangeBar, redBar, stopLevel;

greenBar = Close > Close[Period] And Volume > Volume[1];
blueBar = Close > Close[Period] And Volume < Volume[Period];
orangeBar = Close < Close[Period] And Volume < Volume[Period];
redBar = Close < Close[Period] And Volume > Volume[1];

If greenBar Or blueBar Then
	Begin
		Buy This Bar on Close;
		stopLevel = Close - ( ( Close / 100 ) * Percent_Stop );
	End;

If MarketPosition = 1 Then
	Begin
		stopLevel = MaxList( stopLevel, Close - ( ( Close / 100 ) * Percent_Stop ) );
		Sell("Stop") Next Bar at stopLevel Stop;
		DrawSymbol( stopLevel, "Stop", SymbolDot, 5, DarkGreen, DarkGreen );
	End;

// *** Copyright tradesignal GmbH ***
// *** www.tradesignal.com ***


 TradeSignal code: Color Based Trading.eqi

 Meta:
	Weblink ("https://www.tradesignalonline.com/lexicon/view.aspx?id=16905"),
	Synopsis("Color based trading indicator for long-only trading systems, based on price and volume data from the 07/2011 issue of Stocks and Commodities."),
	ShortCode("CBT"),
	Subchart( True );

Inputs:
	Period( 10 , 1 );

Vars:
	greenBar, blueBar, orangeBar, redBar, stopLevel, barColor;

greenBar = Close > Close[Period] And Volume > Volume[1];
blueBar = Close > Close[Period] And Volume <= Volume[Period];
orangeBar = Close <= Close[Period] And Volume <= Volume[Period];
redBar = Close <= Close[Period] And Volume >= Volume[1];

If greenBar Then
	barColor = DarkGreen
Else If blueBar Then
	barColor = DarkBlue
Else if orangeBar Then
	barColor = ColorOrange
Else if redBar Then
	barColor = red;

DrawForest( 0, Volume, "Zero Volume", "Volume", Thick, barColor );

// *** Copyright tradesignal GmbH ***
// *** www.tradesignal.com ***

VT TRADER: COLOR-BASED SYSTEM
Our Traders’ Tip this month is based on “A Color-Based System For Short-Term Trading” by Edgar Kraut in this issue.
In the article, Kraut describes a trading system that only takes long positions and uses colored volume bars to identify potential trading opportunities. A long trade is initiated on blue or green volume bars using a 1% trailing stop-loss for exits while remaining out of the market for red or orange bars.
Since there is no centralized dollar volume data for the forex industry, we used a two-period average true range (Atr) indicator as a proxy for volume. Kraut describes his color-based trading system as being very flexible for discretionary traders, so we constructed it with that premise in mind. Our clients can customize the lookback periods, define which colored bar(s) to use for entry (including short trades if desired), and choose from three different types of trailing stop-loss logic to use for exits.
A sample chart is shown in Figure 22.
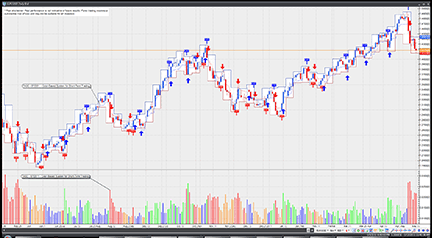
Figure 22: VT TRADER, Color-Based System. Here is an example of the modified color-based trading system on a daily EUR/USD candlestick chart.
We’ll be offering our modified version of Kraut’s color-based trading system for download in our VT client forums at https://forum.vtsystems.com along with hundreds of other precoded and free trading systems. Meanwhile, the VT Trader instructions for creating the modified color-based trading system is also shown here:
- Ribbon→Technical Analysis menu→Trading Systems group→Trading Systems Builder command→[New] button
- In the General tab, type the following text for each field:
Name: TASC - 07/2011 - Color-Based System for Short-Term Trading
Function Name Alias: tasc_cbshorttermsystem
Label Mask: TASC - 07/2011 - Color-Based System for Short-Term Trading
- In the Input Variable(s) tab, create the following variables:
[New] button...
Name: CT
Display Name: Chart Type (Bid/Ask)?
Type: Enumeration
Default: Bid (Click [...] button -> [New] button -> type Bid; [New] button -> type Ask; [OK] button)

[New] button...
Name: Spread
Display Name: Currency Spread (in Pips)
Type: float
Default: 2

[New] button...
Name: TD
Display Name: Select Trades Allowed...
Type: Enumeration
Default: Buy_and_Sell_Trades (Click [...] button -> [New] button -> type Buy_Trades_Only; [New] button -> type Sell_Trades_Only; [New] button -> type Buy_and_Sell_Trades; [OK] button)

[New] button...
Name: LBP
Display Name: Lookback Periods
Type: integer
Default: 10

[New] button...
Name: LEBar
Display Name: Long Entry Condition(s)
Type: Enumeration
Default: Green_OR_Blue_Bar (Click [...] button -> [New] button -> type Green_Bar; [New] button -> type Blue_Bar; [New] button -> type Green_OR_Blue_Bar; [OK] button)

[New] button...
Name: SEBar
Display Name: Short Entry Condition(s)
Type: Enumeration
Default: Orange_OR_Red_Bar (Click [...] button -> [New] button -> type Orange_Bar; [New] button -> type Red_Bar; [New] button -> type Orange_OR_Red_Bar; [OK] button)

[New] button...
Name: TrailingStoplossType
Display Name: Trailing Stoploss Type
Type: Enumeration
Default: Percentage_Based (Click [...] button -> [New] button -> type ATR_Based; [New] button -> type Pip_Based; [New] button -> type Perecentage_Based; [OK] button)

[New] button...
Name: TrailingStoploss
Display Name: Trailing Stoploss (in Pips)
Type: integer
Default: 10

[New] button...
Name: ATRper
Display Name: ATR Periods (if ATR Trailing Stoploss)
Type: integer
Default: 10

[New] button...
Name: atrmultiplier
Display Name: ATR Multiplier (if ATR Trailing Stoploss)
Type: float
Default: 3

[New] button...
Name: SLP
Display Name: Percentage (if % Trailing Stoploss)
Type: float
Default: 1
- In the Output Variable(s) tab, create the following variables:
[New] button...
Var Name: GreenBar
Name: Green Bar
* Checkmark: Indicator Output
Select Indicator Output Tab
Line Color: green
Line Width: 2
Ling Style: histogram
Placement: Additional Frame 1
[OK] button...

[New] button...
Var Name: BlueBar
Name: Blue Bar
* Checkmark: Indicator Output
Select Indicator Output Tab
Line Color: blue
Line Width: 2
Ling Style: histogram
Placement: Additional Frame 1
[OK] button...

[New] button...
Var Name: OrangeBar
Name: Orange Bar
* Checkmark: Indicator Output
Select Indicator Output Tab
Line Color: orange
Line Width: 2
Ling Style: histogram
Placement: Additional Frame 1
[OK] button...

[New] button...
Var Name: RedBar
Name: Red Bar
* Checkmark: Indicator Output
Select Indicator Output Tab
Line Color: red
Line Width: 2
Ling Style: histogram
Placement: Additional Frame 1
[OK] button...

[New] button...
Var Name: DisplayLongEntryTrailingStop
Name: Long Entry Trailing Stop
* Checkmark: Indicator Output
Select Indicator Output Tab
Line Color: blue
Line Width: 1
Ling Style: dashed
Placement: Price Frame
[OK] button...

[New] button...
Var Name: DisplayShortEntryTrailingStop
Name: Short Entry Trailing Stop
* Checkmark: Indicator Output
Select Indicator Output Tab
Line Color: red
Line Width: 1
Ling Style: dashed
Placement: Price Frame
[OK] button...

[New] button...
Var Name: LongEntrySignal
Name: Long Entry Signal
* Checkmark: Graphic Enabled
* Checkmark: Alerts Enabled
Select Graphic Tab
Font [...]: Up Arrow
Size: Medium
Color: Blue
Symbol Position: Below price plot
	Select Alerts Tab
		Alert Message: Long Entry Signal
		Alert Sound: others.wav
[OK] button...

[New] button...
Var Name: LongExitSignal
Name: Long Exit Signal
* Checkmark: Graphic Enabled
* Checkmark: Alerts Enabled
Select Graphic Tab
Font [...]: Exit Sign
Size: Medium
Color: Blue
Symbol Position: Above price plot
	Select Alerts Tab
		Alert Message: Long Exit Signal
		Alert Sound: others.wav
[OK] button...

[New] button...
Var Name: ShortEntrySignal
Name: Short Entry Signal
* Checkmark: Graphic Enabled
* Checkmark: Alerts Enabled
Select Graphic Tab
Font [...]: Down Arrow
Size: Medium
Color: Red
Symbol Position: Above price plot
	Select Alerts Tab
		Alert Message: Short Entry Signal
		Alert Sound: others.wav
[OK] button...

[New] button...
Var Name: ShortExitSignal
Name: Short Exit Signal
* Checkmark: Graphic Enabled
* Checkmark: Alerts Enabled
Select Graphic Tab
Font [...]: Exit Sign
Size: Medium
Color: Red
Symbol Position: Below price plot
	Select Alerts Tab
		Alert Message: Short Exit Signal
		Alert Sound: others.wav
[OK] button...

[New] button...
Var Name: OpenBuy
Name: Open Buy
* Checkmark: Trading Enabled
Select Trading Tab
Trading Action: BUY
[OK] button...

[New] button...
Var Name: CloseBuy
Name: Close Buy
* Checkmark: Trading Enabled
Select Trading Tab
Trading Action: SELL
[OK] button...

[New] button...
Var Name: OpenSell
Name: Open Sell
* Checkmark: Trading Enabled
Select Trading Tab
Trading Action: SELL
[OK] button...

[New] button...
Var Name: CloseSell
Name: Close Sell
* Checkmark: Trading Enabled
Select Trading Tab
Trading Action: BUY
[OK] button...
- In the Formula tab, copy and paste the following formula:
{Provided By: Capital Market Services, LLC & Visual Trading Systems, LLC} {Copyright: 2011} {Description: TASC, July 2011 - “A Color-Based System For Short-Term Trading” by Edgar Kraut} {File: tasc_cbshorttermsystem - Version 1.0} {Average True Range - Substitute for Volume} _ATR:= ATR(2); {Colored ATR Bars - Substitute for Colored Volume Bars} GreenBar:= if(C>ref(C,-LBP) AND _ATR>ref(_ATR,-LBP),_ATR,NULL); BlueBar:= if(C>ref(C,-LBP) AND _ATR<ref(_ATR,-LBP),_ATR,NULL); OrangeBar:= if(C<ref(C,-LBP) AND _ATR<ref(_ATR,-LBP),_ATR,NULL); RedBar:= if(C<ref(C,-LBP) AND _ATR>ref(_ATR,-LBP),_ATR,NULL); {Define Final Trade Entry/Exit Criteria} LongEntryCond1:= (LEBar=0 OR LEBar=2) AND C>ref(C,-LBP) AND _ATR>ref(_ATR,-LBP); LongEntryCond2:= (LEBar=1 OR LEBar=2) AND C>ref(C,-LBP) AND _ATR<ref(_ATR,-LBP); ShortEntryCond1:= (SEBar=0 OR SEBar=2) AND C<ref(C,-LBP) AND _ATR<ref(_ATR,-LBP); ShortEntryCond2:= (SEBar=1 OR SEBar=2) AND C<ref(C,-LBP) AND _ATR>ref(_ATR,-LBP); LongEntrySetup:= LongEntryCond1=1 OR LongEntryCond2=1; ShortEntrySetup:= ShortEntryCond1=1 OR ShortEntryCond2=1; {Convert input data to instrument-specific values} Barnum:= BarCount(); _SymbolPoint:= SymbolPoint(); _TrailingStoploss:= TrailingStoploss * _SymbolPoint; _Spread:= Spread * _SymbolPoint; {Long Entry Signal} LongEntrySignal:= ((TD=0 OR TD=2) AND LongTradeAlert=0 AND ShortTradeAlert=0 AND LongEntrySetup=1); {Long Entry Price Simulated Data For Exit Options} LongEntryPrice:= valuewhen(1,LongEntrySignal=1,C) + (If(CT=0,_Spread,0)); BarsSinceLongEntry:= BarsSince(LongEntrySignal=1); {Long Trade Trailing Stoploss} LongEntryPipTrailingStop:= If(LongEntrySignal=1, LongEntryPrice - _TrailingStoploss, If(LongTradeAlert=1, max((C - _TrailingStoploss), PREV(LongEntryPrice - _TrailingStoploss)), null)); LongEntryATRTrailingStop:= If(LongEntrySignal=1, H - (ATR(ATRper) * atrmultiplier), If(LongTradeAlert=1, max(HHV(H,BarsSinceLongEntry) - (ATR(ATRper) * atrmultiplier), PREV(valuewhen(1,LongEntrySignal=1,H) - (ATR(ATRper) * atrmultiplier))), null)); LongEntryPercentTrailingStop:= If(LongEntrySignal=1, C - C*(SLP/100), If(LongTradeAlert=1, max(HHV(C,BarsSinceLongEntry) - C*(SLP/100), PREV(valuewhen(1,LongEntrySignal=1,C) - C*(SLP/100))), null)); DisplayLongEntryTrailingStop:= If(TrailingStoplossType=1, LongEntryPipTrailingStop, If(TrailingStoplossType=0, LongEntryATRTrailingStop, If(TrailingStoplossType=2, LongEntryPercentTrailingStop, null))); {Long Exit Signal} LongExitSignal:= (LongTradeAlert=1 AND TrailingStoplossType=1 AND Cross(LongEntryPipTrailingStop,C)) OR (LongTradeAlert=1 AND TrailingStoplossType=0 AND Cross(LongEntryATRTrailingStop,C)) OR (LongTradeAlert=1 AND TrailingStoplossType=2 AND Cross(LongEntryPercentTrailingStop,C)); {Short Entry Signal} ShortEntrySignal:= ((TD=1 OR TD=2) AND ShortTradeAlert=0 AND LongTradeAlert=0 AND ShortEntrySetup=1); {Short Entry Price Simulated Data For Exit Options} ShortEntryPrice:= valuewhen(1,ShortEntrySignal=1,C) - (If(CT=1,_Spread,0)); BarsSinceShortEntry:= BarsSince(ShortEntrySignal=1); {Short Trade Trailing Stoploss} ShortEntryPipTrailingStop:= If(ShortEntrySignal=1, ShortEntryPrice + _TrailingStoploss, If(ShortTradeAlert=1, min((C + _TrailingStoploss), PREV(ShortEntryPrice + _TrailingStoploss)), null)); ShortEntryATRTrailingStop:= If(ShortEntrySignal=1, L + (ATR(ATRper) * atrmultiplier), If(ShortTradeAlert=1, min(LLV(L,BarsSinceShortEntry) + (ATR(ATRper) * atrmultiplier), PREV(valuewhen(1,ShortEntrySignal,L) + (ATR(ATRper) * atrmultiplier))), null)); ShortEntryPercentTrailingStop:= If(ShortEntrySignal=1, C + C*(SLP/100), If(ShortTradeAlert=1, min(LLV(C,BarsSinceShortEntry) + C*(SLP/100), PREV(valuewhen(1,ShortEntrySignal,C) + C*(SLP/100))), null)); DisplayShortEntryTrailingStop:= If(TrailingStoplossType=1, ShortEntryPipTrailingStop, If(TrailingStoplossType=0, ShortEntryATRTrailingStop, If(TrailingStoplossType=2, ShortEntryPercentTrailingStop, null))); {{Short Exit Signal} ShortExitSignal:= (ShortTradeAlert=1 AND TrailingStoplossType=1 AND Cross(C,ShortEntryPipTrailingStop)) OR (ShortTradeAlert=1 AND TrailingStoplossType=0 AND Cross(C,ShortEntryATRTrailingStop)) OR (ShortTradeAlert=1 AND TrailingStoplossType=2 AND Cross(C,ShortEntryPercentTrailingStop)); {Open Trade Determination for Long/Short EntryExit Signals} LongTradeAlert:= SignalFlag(LongEntrySignal,LongExitSignal); ShortTradeAlert:= SignalFlag(ShortEntrySignal,ShortExitSignal); {Create Auto-Trading Functionality; Only used in Auto-Trade Mode} OpenBuy:= LongEntrySignal=1 AND BuyPositionCount()=0; CloseBuy:= LongExitSignal=1 AND BuyPositionCount()>0; OpenSell:= ShortEntrySignal=1 AND SellPositionCount()=0; CloseSell:= ShortExitSignal=1 AND SellPositionCount()>0; - Click the “Save” icon to finish building the trading system.
To learn more about VT Trader, visit www.vtsystems.com.
Risk disclaimer: Forex trading involves a substantial risk of loss and may not be suitable for all investors.
COLOR-BASED SYSTEM — KRAUT ARTICLE CODE
To Produce Colored Bars In Metastock
To produce the colored volume window, the green, blue, orange, and red indicators are dropped onto the monochrome volume bars of a chart as histograms.
Green Bar:

P2 := C;
V2 :=V;
P1 := Ref(C, -10);
V1 := Ref(V, -10);

If (P2 > P1 AND V2>V1, 1,0)

Blue Bar:

P2 := C;
V2 :=V;
P1 := Ref(C, -10);
V1 := Ref(V, -10);

If (P2 > P1 AND V2 < V1, 1,0)

Orange Bar:

P2 := C;
V2 :=V;
P1 := Ref(C, -10);
V1 := Ref(V, -10);

If (P2 < P1 AND V2 <V1, 1,0)

Red Bar:

P2 := C;
V2 :=V;
P1 := Ref(C, -10);
V1 := Ref(V, -10);

If (P2 < P1 AND V2 > V1, 1,0)