TRADERS’ TIPS
November 2012
Here is this month’s selection of Traders’ Tips, contributed by
various developers of technical analysis software to help readers more easily
implement some of the strategies presented in this and other issues.
Other code appearing in articles in this issue is posted in the Subscriber
Area of our website at https://technical.traders.com/sub/sublogin.asp.
Login requires your last name and subscription number (from mailing label).
Once logged in, scroll down to beneath the “Optimized trading systems” area
until you see “Code from articles.” From there, code can be copied
and pasted into the appropriate technical analysis program so that no retyping
of code is required for subscribers.
You can copy these formulas and programs for easy use in your spreadsheet
or analysis software. Simply “select” the desired text
by highlighting as you would in any word processing program, then use your
standard key command for copy or choose “copy” from the browser
menu. The copied text can then be “pasted” into any open spreadsheet
or other software by selecting an insertion point and executing a paste command.
By toggling back and forth between an application window and the open web
page, data can be transferred with ease.

For this month’s Traders’ Tips, the focus is BC Low’s article in this issue, “Identify The Start Of A Trend With DMI.” Here we present the November 2012 Traders’ Tips code.
Code for Excel is already provided in Low’s article by the author, and subscribers will find this code in the Subscriber Area of our website, Traders.com. (Click on “Article Code” from our homepage.) Presented here is additional code and possible implementations for other software.

TRADESTATION: NOVEMBER 2012 TRADERS’ TIPS CODE
In “Identify The Start Of A Trend With DMI” in this issue, author BC Low describes the use of “clusters” of ADX, +DI, and -DI to aid in identification of the start of trends as well as potential market tops and bottoms. The article discusses the congestion of the clusters above/below certain threshold levels as aids in picking turning points and reducing risk.
Shown in Figure 1 are three indicators that plot the three ADX values, the three +DI values, and the three -DI values.
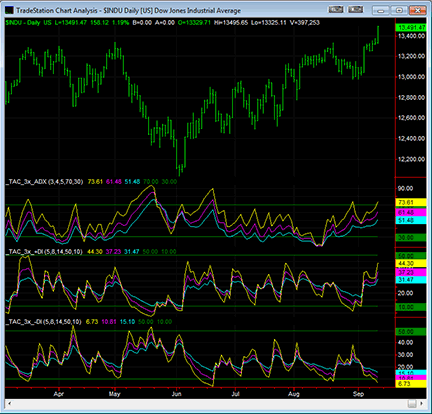
FIGURE 1: TRADESTATION. Here is an example of the three indicators applied to a daily bar chart of $INDU (Dow Jones Industrial Average).
To download the EasyLanguage code for the indicators, first navigate to the EasyLanguage FAQs and Reference Posts Topic in the EasyLanguage support forum (https://www.tradestation.com/Discussions/Topic.aspx?Topic_ID=47452), scroll down, and click on the link labeled “Traders’ Tips, TASC.” Then select the appropriate link for the month and year. The ELD filename is “_TAC-DMI_CLUSTERS.ELD.”
The EasyLanguage code is also shown below.
_TAC_3x_ADX ( Indicator )

{ Identify the Start of a Trend With DMI }
{ Technical Analysis of Stocks and Commodities,
  November 2012 }
{ BC Low, CMT }

inputs:
	ADXLength1( 3 ),
	ADXLength2( 4 ),
	ADXLength3( 5 ),
	HiRefLevel( 70 ), { high reference level }
	LoRefLevel( 30 ) ; { low reference level }

variables:
	ADX1( 0 ),
	ADX2( 0 ),
	ADX3( 0 ) ;

{ calculate the 3 ADX values }
ADX1 = ADX( ADXLength1 ) ;
ADX2 = ADX( ADXLength2 ) ;
ADX3 = ADX( ADXLength3 ) ;

{ plot the ADX values and reference levels }
Plot1( ADX1, "ADX1" ) ;
Plot2( ADX2, "ADX2" ) ;
Plot3( ADX3, "ADX3" ) ;
Plot4( HiRefLevel, "Hi Ref" ) ;
Plot5( LoRefLevel, "Lo Ref" ) ;


_TAC_3x_+DI ( Indicator )

{ Identify the Start of a Trend With DMI }
{ Technical Analysis of Stocks and Commodities,
  November 2012 }
{ BC Low, CMT }

inputs:
	DMIPlusLength1( 5 ),
	DMIPlusLength2( 8 ),
	DMIPlusLength3( 14 ),
	HiRefLevel( 50 ), { high reference level }
	LoRefLevel( 10 ) ; { low reference level }

variables:
	DMIPlus1( 0 ),
	DMIPlus2( 0 ),
	DMIPlus3( 0 ) ;

{ calculate the 3 +DMI values }
DMIPlus1 = DMIPlus( DMIPlusLength1 ) ;
DMIPlus2 = DMIPlus( DMIPlusLength2 ) ;
DMIPlus3 = DMIPlus( DMIPlusLength3 ) ;

{ plot the +DMI values and reference levels }
Plot1( DMIPlus1, "+DMI 1" ) ;
Plot2( DMIPlus2, "+DMI 2" ) ;
Plot3( DMIPlus3, "+DMI 3" ) ;
Plot4( HiRefLevel, "Hi Ref" ) ;
Plot5( LoRefLevel, "Lo Ref" ) ;


_TAC_3x_-DI ( Indicator )

{ Identify the Start of a Trend With DMI }
{ Technical Analysis of Stocks and Commodities,
  November 2012 }
{ BC Low, CMT }

inputs:
	DMIMinusLength1( 5 ),
	DMIMinusLength2( 8 ),
	DMIMinusLength3( 14 ),
	HiRefLevel( 50 ), { high reference level }
	LoRefLevel( 10 ) ; { low reference level }

variables:
	DMIMinus1( 0 ),
	DMIMinus2( 0 ),
	DMIMinus3( 0 ) ;

{ calculate the 3 -DMI values}
DMIMinus1 = DMIMinus( DMIMinusLength1 ) ;
DMIMinus2 = DMIMinus( DMIMinusLength2 ) ;
DMIMinus3 = DMIMinus( DMIMinusLength3 ) ;

{ plot the -DMI values and reference levels }
Plot1( DMIMinus1, "-DMI 1" ) ;
Plot2( DMIMinus2, "-DMI 2" ) ;
Plot3( DMIMinus3, "-DMI 3" ) ;
Plot4( HiRefLevel, "Hi Ref" ) ;
Plot5( LoRefLevel, "Lo Ref" ) ;
This article is for informational purposes. No type of trading or investment recommendation, advice, or strategy is being made, given, or in any manner provided by TradeStation Securities or its affiliates.
—Chris Imhof
TradeStation Securities, Inc.
A subsidiary of TradeStation Group, Inc.
www.TradeStation.com
BACK TO LIST

METASTOCK: NOVEMBER 2012 TRADERS’ TIPS CODE
BC Low’s article in this issue, “Identify The Start Of A Trend With DMI,” presents several patterns to signal the beginning and end of trends. We are providing the MetaStock formulas for those signals, shown at Traders.com in the Traders’ Tips area. These are binary formulas that will normally have a value of zero and a value of 1 when the signal is found. They can be used in any of the formula tools.
The steps to enter those formulas in an exploration in order to set up a system test in MetaStock are as follows:
- Select Tools → Explorer
- Click New
- Enter a name for the exploration
- Select the Filter tab and enter the formula
- Click OK to close the exploration editor.
The formulas are:
ADX clusters
Formula for the start of move:

a1:= ADX(3);
a2:= ADX(4);
a3:= ADX(5);
a1 = a2 AND a1 = a3 AND a1 < 30


Formula for the end of a move:

a1:= ADX(3);
a2:= ADX(4);
a3:= ADX(5);
70 < min(a1, min(a2, a3)) AND
cross(0, roc(a1,1,$)) AND
cross(0, roc(a2,1,$)) AND
cross(0, roc(a3,1,$))


+DI clusters
Formula for a market bottom:

p1:= PDI(5);
p2:= PDI(8);
p3:= PDI(14);
mark:= 10 > Max(p1, Max(p2, p3)) AND
5 > Min(p1, Min(p2, p3));
Ref(mark,-1) AND ROC(p1,1,$)>0 AND
ROC(p2,1,$)>0 AND ROC(p3,1,$)>0


Formula for a strong buy:

a1:= ADX(3);
a2:= ADX(4);
a3:= ADX(5);
p1:= PDI(5);
p2:= PDI(8);
p3:= PDI(14);
mark:= 10 > Max(p1, Max(p2, p3)) AND
5 > Min(p1, Min(p2, p3));
70 < min(a1, min(a2, a3)) AND
90 < max(a1, max(a2, a3)) AND
cross(0, roc(a1,1,$)) AND
cross(0, roc(a2,1,$)) AND
cross(0, roc(a3,1,$)) AND
Ref(mark,-1) AND ROC(p1,1,$)>0 AND
ROC(p2,1,$)>0 AND ROC(p3,1,$)>0


-DI clusters:
Formula for a market top:

m1:= PDI(5);
m2:= PDI(8);
m3:= PDI(14);
mark:= 10 > Max(m1, Max(m2, m3)) AND
5 > Min(m1, Min(m2, m3));
Ref(mark,-1) AND ROC(m1,1,$)>0 AND
ROC(m2,1,$)>0 AND ROC(m3,1,$)>0


Formula for a strong sell:

a1:= ADX(3);
a2:= ADX(4);
a3:= ADX(5);
m1:= PDI(5);
m2:= PDI(8);
m3:= PDI(14);
mark:= 10 > Max(m1, Max(m2, m3)) AND
5 > Min(m1, Min(m2, m3));
70 < min(a1, min(a2, a3)) AND
90 < max(a1, max(a2, a3)) AND
cross(0, roc(a1,1,$)) AND
cross(0, roc(a2,1,$)) AND
cross(0, roc(a3,1,$)) AND
Ref(mark,-1) AND ROC(m1,1,$)>0 AND
ROC(m2,1,$)>0 AND ROC(m3,1,$)>0
—William Golson
MetaStock Technical Support
Thomson Reuters
BACK TO LIST

eSIGNAL: NOVEMBER 2012 TRADERS’ TIPS CODE
For this month’s Traders’ Tip, we’ve provided the formulas, 3x_ADX.efs, 3x_-DI.efs, and 3x_+DI.efs, based on BC Low’s article in this issue, “Identify The Start Of A Trend With DMI.”
All three indicators contain formula parameters to set the colors of their three indicator lines, which may be configured through the Edit Chart window.
To discuss this study or download a complete copy of the formula code, please visit the EFS Library Discussion Board forum under the Forums link from the support menu at www.esignal.com or visit our EFS KnowledgeBase at www.esignal.com/support/kb/efs/. The eSignal formula scripts (EFS) are also available for copying and pasting below.
3x_-DI.efs

/*********************************
Provided By:
eSignal (Copyright c eSignal), a division of Interactive Data
Corporation. 2012. All rights reserved. This sample eSignal
Formula Script (EFS) is for educational purposes only and may be
modified and saved under a new file name.  eSignal is not responsible
for the functionality once modified.  eSignal reserves the right
to modify and overwrite this EFS file with each new release.

Description:
Identify the start of a trend with DMI by BC Low, CMT

Version:            1.00  13/09/2012

Formula Parameters:                     Default:
3X - DI Color 1                         green
3X - DI Color 2                         blue

3X - DI Color 3                         olive

Notes:
The related article is copyrighted material. If you are not a subscriber
of Stocks & Commodities, please visit www.traders.com.

**********************************/

var fpArray = new Array();

function preMain()
{
    setStudyTitle("3X - DI CLUSTER");

    setCursorLabelName("NDI5", 0);
    setCursorLabelName("NDI8", 1);

    setCursorLabelName("NDI14", 2);

    var x=0;

    fpArray[x] = new FunctionParameter("gNDI5Color", FunctionParameter.COLOR);
    with(fpArray[x++])
    {
        setName("3X - DI Color 1");
        setDefault(Color.green);
    }

    fpArray[x] = new FunctionParameter("gNDI8Color", FunctionParameter.COLOR);
    with(fpArray[x++])
    {
        setName("3X - DI Color 2");
        setDefault(Color.blue);
    }


    fpArray[x] = new FunctionParameter("gNDI14Color", FunctionParameter.COLOR);
    with(fpArray[x++])
    {
        setName("3X - DI Color 3");
        setDefault(Color.olive);
    }
}


var bInit = false;
var bVersion = null;

var xNDI5 = null;

var xNDI8 = null;
var xNDI14 = null;

function main(gNDI5Color,gNDI8Color,gNDI14Color)
{
    if (bVersion == null) bVersion = verify();
    if (bVersion == false) return;

    if(!bInit)
    {
        xNDI5 = ndi(5,5);

        xNDI8 = ndi(8,8);

        xNDI14 = ndi(14,14);


        addBand(20,PS_DASH,1,Color.maroon,0);

        addBand(30,PS_SOLID,1,Color.maroon,1);

        addBand(70,PS_SOLID,1,Color.maroon,2);

        addBand(90,PS_DASH,1,Color.maroon,3);


        setDefaultBarFgColor(gNDI5Color, 0);

        setDefaultBarFgColor(gNDI8Color, 1);

        setDefaultBarFgColor(gNDI14Color, 2);

        bInit = true;
    }

    var vNDI5 = xNDI5.getValue(0);

    var vNDI8 = xNDI8.getValue(0);

    var vNDI14 = xNDI14.getValue(0);


    if ((vNDI5 == null) || (vNDI8 == null) || (vNDI14 == null))
        return;

    return new Array(vNDI5,vNDI8,vNDI14);
}

function verify() {
    var b = false;
    if (getBuildNumber() < 779) {
        drawTextAbsolute(5, 35, "This study requires version 8.0 or later.",
        Color.white, Color.blue, Text.RELATIVETOBOTTOM|Text.RELATIVETOLEFT|Text.BOLD|Text.LEFT,
        null, 13, "error");
        drawTextAbsolute(5, 20, "Click HERE to upgrade.@URL=https://www.esignal.com/download/default.asp",
        Color.white, Color.blue, Text.RELATIVETOBOTTOM|Text.RELATIVETOLEFT|Text.BOLD|Text.LEFT,
        null, 13, "upgrade");
        return b;
    } else {
        b = true;
    }
    return b;
}
3x_+DI.efs

/*********************************
Provided By:
eSignal (Copyright c eSignal), a division of Interactive Data
Corporation. 2012. All rights reserved. This sample eSignal
Formula Script (EFS) is for educational purposes only and may be
modified and saved under a new file name.  eSignal is not responsible
for the functionality once modified.  eSignal reserves the right
to modify and overwrite this EFS file with each new release.

Description:
Identify the start of a trend with DMI by BC Low, CMT

Version:            1.00  13/09/2012

Formula Parameters:                     Default:
3X + DI Color 1                         green
3X + DI Color 2                         blue

3X + DI Color 3                         olive

Notes:
The related article is copyrighted material. If you are not a subscriber
of Stocks & Commodities, please visit www.traders.com.

**********************************/

var fpArray = new Array();

function preMain()
{
    setStudyTitle("3X + DI CLUSTER");

    setCursorLabelName("PDI5", 0);
    setCursorLabelName("PDI8", 1);

    setCursorLabelName("PDI14", 2);

    var x=0;

    fpArray[x] = new FunctionParameter("gPDI5Color", FunctionParameter.COLOR);
    with(fpArray[x++])
    {
        setName("3X + DI Color 1");
        setDefault(Color.green);
    }

    fpArray[x] = new FunctionParameter("gPDI8Color", FunctionParameter.COLOR);
    with(fpArray[x++])
    {
        setName("3X + DI Color 2");
        setDefault(Color.blue);
    }


    fpArray[x] = new FunctionParameter("gPDI14Color", FunctionParameter.COLOR);
    with(fpArray[x++])
    {
        setName("3X + DI Color 3");
        setDefault(Color.olive);
    }
}


var bInit = false;
var bVersion = null;

var xPDI5 = null;

var xPDI8 = null;
var xPDI14 = null;

function main(gPDI5Color,gPDI8Color,gPDI14Color)
{
    if (bVersion == null) bVersion = verify();
    if (bVersion == false) return;

    if(!bInit)
    {
        xPDI5 = pdi(5,5);

        xPDI8 = pdi(8,8);

        xPDI14 = pdi(14,14);


        addBand(20,PS_DASH,1,Color.maroon,0);

        addBand(30,PS_SOLID,1,Color.maroon,1);

        addBand(70,PS_SOLID,1,Color.maroon,2);

        addBand(90,PS_DASH,1,Color.maroon,3);


        setDefaultBarFgColor(gPDI5Color, 0);

        setDefaultBarFgColor(gPDI8Color, 1);

        setDefaultBarFgColor(gPDI14Color, 2);

        bInit = true;
    }

    var vPDI5 = xPDI5.getValue(0);

    var vPDI8 = xPDI8.getValue(0);

    var vPDI14 = xPDI14.getValue(0);


    if ((vPDI5 == null) || (vPDI8 == null) || (vPDI14 == null))
        return;

    return new Array(vPDI5,vPDI8,vPDI14);
}

function verify() {
    var b = false;
    if (getBuildNumber() < 779) {
        drawTextAbsolute(5, 35, "This study requires version 8.0 or later.",
        Color.white, Color.blue, Text.RELATIVETOBOTTOM|Text.RELATIVETOLEFT|Text.BOLD|Text.LEFT,
        null, 13, "error");
        drawTextAbsolute(5, 20, "Click HERE to upgrade.@URL=https://www.esignal.com/download/default.asp",
        Color.white, Color.blue, Text.RELATIVETOBOTTOM|Text.RELATIVETOLEFT|Text.BOLD|Text.LEFT,
        null, 13, "upgrade");
        return b;
    } else {
        b = true;
    }
    return b;
}
3x_ADX.efs

/*********************************
Provided By:
eSignal (Copyright c eSignal), a division of Interactive Data
Corporation. 2012. All rights reserved. This sample eSignal
Formula Script (EFS) is for educational purposes only and may be
modified and saved under a new file name.  eSignal is not responsible
for the functionality once modified.  eSignal reserves the right
to modify and overwrite this EFS file with each new release.

Description:
Identify the start of a trend with DMI by BC Low, CMT

Version:            1.00  13/09/2012

Formula Parameters:                     Default:
ADX Color 1                             green
ADX Color 2                             blue

ADX Color 1                             olive

Notes:
The related article is copyrighted material. If you are not a subscriber
of Stocks & Commodities, please visit www.traders.com.

**********************************/

var fpArray = new Array();

function preMain()
{
    setStudyTitle("3X ADX CLUSTER");

    setCursorLabelName("ADX3", 0);
    setCursorLabelName("ADX4", 1);

    setCursorLabelName("ADX5", 2);

    var x=0;

    fpArray[x] = new FunctionParameter("gADX3Color", FunctionParameter.COLOR);
    with(fpArray[x++])
    {
        setName("ADX Color 1");
        setDefault(Color.green);
    }

    fpArray[x] = new FunctionParameter("gADX4Color", FunctionParameter.COLOR);
    with(fpArray[x++])
    {
        setName("ADX Color 2");
        setDefault(Color.blue);
    }


    fpArray[x] = new FunctionParameter("gADX5Color", FunctionParameter.COLOR);
    with(fpArray[x++])
    {
        setName("ADX Color 3");
        setDefault(Color.olive);
    }
}


var bInit = false;
var bVersion = null;

var xADX3 = null;

var xADX4 = null;
var xADX5 = null;

function main(gADX3Color,gADX4Color,gADX5Color)
{
    if (bVersion == null) bVersion = verify();
    if (bVersion == false) return;

    if(!bInit)
    {
        xADX3 = adx(3,3);

        xADX4 = adx(4,4);

        xADX5 = adx(5,5);


        addBand(20,PS_DASH,1,Color.maroon,0);

        addBand(30,PS_SOLID,1,Color.maroon,1);

        addBand(70,PS_SOLID,1,Color.maroon,2);

        addBand(90,PS_DASH,1,Color.maroon,3);


        setDefaultBarFgColor(gADX3Color, 0);

        setDefaultBarFgColor(gADX4Color, 1);

        setDefaultBarFgColor(gADX5Color, 2);

        bInit = true;
    }

    var vADX3 = xADX3.getValue(0);

    var vADX4 = xADX4.getValue(0);

    var vADX5 = xADX5.getValue(0);


    if ((vADX3 == null) || (vADX4 == null) || (vADX5 == null))
        return;

    return new Array(vADX3,vADX4,vADX5);
}

function verify() {
    var b = false;
    if (getBuildNumber() < 779) {
        drawTextAbsolute(5, 35, "This study requires version 8.0 or later.",
        Color.white, Color.blue, Text.RELATIVETOBOTTOM|Text.RELATIVETOLEFT|Text.BOLD|Text.LEFT,
        null, 13, "error");
        drawTextAbsolute(5, 20, "Click HERE to upgrade.@URL=https://www.esignal.com/download/default.asp",
        Color.white, Color.blue, Text.RELATIVETOBOTTOM|Text.RELATIVETOLEFT|Text.BOLD|Text.LEFT,
        null, 13, "upgrade");
        return b;
    } else {
        b = true;
    }
    return b;
}
A sample chart of the indicators is shown in Figure 2.
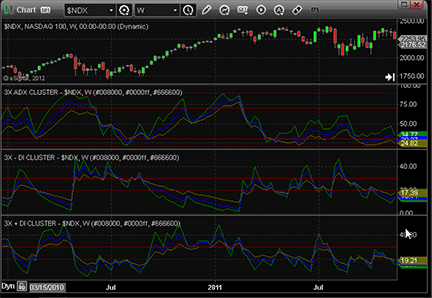
FIGURE 2: eSIGNAL
—Jason Keck
eSignal, an Interactive Data company
800 779-6555, www.eSignal.com
BACK TO LIST

THINKORSWIM: NOVEMBER 2012 TRADERS’ TIPS CODE
In “Identify The Start Of A Trend With DMI” in this issue, author BC Low discusses the importance of using the ADX, +DI, and -DI lines in conjunction with each other.
The traditional DMI study displays three lines calculated on one period, whereas the TAC-DMI breaks down each component of the DMI study into its own study, displaying three lines each (Figure 3). This allows for a much more sensitive and a more holistic view of the DMI.
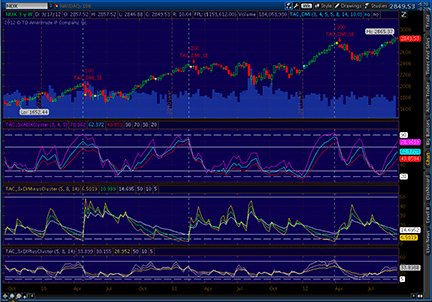
FIGURE 3: THINKORSWIM
For thinkorswim users, we have created three studies and a strategy in our proprietary scripting language, thinkScript. Once the strategy has been added to your chart, you can right-click on the name of the strategy on the price graph and choose “Show report.” This will allow you to see how the strategy has performed over the charted time frame. Adjust the parameters of the strategy within the Edit Studies window to fine-tune your entry and exits points.
The studies:
- From TOS charts, select Studies → Edit Studies
- Select the “Studies” tab in the upper left-hand corner
- Select “New” in the lower left-hand corner
- There are three studies this month separated by pound signs (#)
- Name the studies (such as, “TAC_3xADXCluster,” “TAC_3xDIMinusCluster,” and “TAC_3xDIPlusCluster)”
- Click in the script editor window, remove “plot data = close” and paste in the following.
###################
#TAC_3xADXCluster
declare lower;

input adxLength1 = 3;
input adxLength2 = 4;
input adxLength3 = 5;

plot ADX1 = DMI(adxLength1).ADX;
plot ADX2 = DMI(adxLength2).ADX;
plot ADX3 = DMI(adxLength3).ADX;
plot Level90 = 90;
plot Level70 = 70;
plot Level30 = 30;
plot Level20 = 20;

ADX1.SetDefaultColor(GetColor(0));
ADX2.SetDefaultColor(GetColor(1));
ADX3.SetDefaultColor(GetColor(5));
Level90.SetDefaultColor(GetColor(9));
Level90.SetStyle(Curve.LONG_DASH);
Level70.SetDefaultColor(GetColor(9));
Level30.SetDefaultColor(GetColor(9));
Level20.SetDefaultColor(GetColor(9));
Level20.SetStyle(Curve.LONG_DASH);

###################
#TAC_3xDIMinusCluster
declare lower;

input diLength1 = 5;
input diLength2 = 8;
input diLength3 = 14;

plot DIMinus1 = DMI(diLength1)."DI-";
plot DIMinus2 = DMI(diLength2)."DI-";
plot DIMinus3 = DMI(diLength3)."DI-";
plot Level50 = 50;
plot Level10 = 10;
plot Level5 = 5;

DIMinus1.SetDefaultColor(GetColor(4));
DIMinus2.SetDefaultColor(GetColor(6));
DIMinus3.SetDefaultColor(GetColor(9));
Level50.SetDefaultColor(GetColor(9));
Level10.SetDefaultColor(GetColor(9));
Level5.SetDefaultColor(GetColor(9));
Level5.SetStyle(Curve.LONG_DASH);

##################
#TAC_3xDIPlusCluster

declare lower;

input diLength1 = 5;
input diLength2 = 8;
input diLength3 = 14;

plot DIPlus1 = DMI(diLength1);
plot DIPlus2 = DMI(diLength2);
plot DIPlus3 = DMI(diLength3);
plot Level50 = 50;
plot Level10 = 10;
plot Level5 = 5;

diPlus1.SetDefaultColor(GetColor(3));
diPlus2.SetDefaultColor(GetColor(2));
diPlus3.SetDefaultColor(GetColor(8));
level50.SetDefaultColor(GetColor(9));
level10.SetDefaultColor(GetColor(9));
Level5.SetDefaultColor(GetColor(9));
Level5.SetStyle(Curve.LONG_DASH);
The Strategy:
- From our TOS Charts, Select “Studies” → “Edit Studies”.
- Select the “Strategies” tab in the upper left hand corner.
- Select “New” in the lower left hand corner.
- Name the Oscillator study (i.e. TAC_DMI)
- Click in the script editor window, remove “plot data = close” and paste the following:
input adxLength1 = 3;
input adxLength2 = 4;
input adxLength3 = 5;
input diLength1 = 5;
input diLength2 = 8;
input diLength3 = 14;
input tol = 2.0;

def adx1 = DMI(adxLength1).ADX;
def adx2 = DMI(adxLength2).ADX;
def adx3 = DMI(adxLength3).ADX;
def diPlus1 = DMI(diLength1);
def diPlus2 = DMI(diLength2);
def diPlus3 = DMI(diLength3);
def diMinus1 = DMI(diLength1)."DI-";
def diMinus2 = DMI(diLength2)."DI-";
def diMinus3 = DMI(diLength3)."DI-";

def maxAdx = Max(adx1, Max(adx2, adx3));
def minAdx = Min(adx1, Min(adx2, adx3));
def avgAdx = (adx1 + adx2 + adx3) / 3;
def minDiPlus = Min(diPlus1, Min(diPlus2, diPlus3));
def avgDiPlus = (diPlus1 + diPlus2 + diPlus3) / 3;
def minDiMinus  = Min(diMinus1, Min(diMinus2, diMinus3));
def avgDiMinus = (diMinus1 + diMinus2 + diMinus3) / 3;

def adxPeaksFrom70 = avgAdx[1] > 70 and
    adx1 - adx1[1] crosses below 0 and
    adx2 - adx2[1] crosses below 0 and
    adx3 - adx3[1] crosses below 0;

def diPlusBottom5 = avgDiPlus[1] < 10 and
    minDiPlus crosses above 5;
def diMinusBottom5 = avgDiMinus[1] < 10 and
    minDiMinus crosses above 5;

plot Signal1 = maxAdx[1] < 30 and
    (maxAdx[1] - minAdx[1]) < tol and
    adx1 - adx1[1] crosses above 0 and
    adx2 - adx2[1] crosses above 0 and
    adx3 - adx3[1] crosses above 0;

plot Signal2 = adxPeaksFrom70;

def signal3 = diPlusBottom5 and adxPeaksFrom70;
def signal4 = diMinusBottom5 and adxPeaksFrom70;

Signal1.SetPaintingStrategy(PaintingStrategy.BOOLEAN_POINTS);
Signal1.SetLineWeight(3);
Signal1.DefineColor("Normal", GetColor(1));
Signal1.DefineColor("Stronger", GetColor(2));
Signal1.AssignValueColor(if maxAdx[1] < 20 then Signal1.Color("Stronger") else Signal1.Color("Normal"));

Signal2.SetPaintingStrategy(PaintingStrategy.BOOLEAN_POINTS);
Signal2.SetLineWeight(3);
Signal2.DefineColor("Normal", GetColor(3));
Signal2.DefineColor("Stronger", GetColor(4));
Signal2.AssignValueColor(if maxAdx[1] > 90 then Signal2.Color("Stronger") else Signal2.Color("Normal"));

AddOrder(OrderType.BUY_AUTO, signal3, tickColor = GetColor(6), arrowColor = GetColor(6), name = "TAC_DMI_LE");
AddOrder(OrderType.SELL_AUTO, signal4, tickColor = GetColor(5), arrowColor = GetColor(5), name = "TAC_DMI_SE");
—thinkorswim
A division of TD Ameritrade, Inc.
www.thinkorswim.com
BACK TO LIST

BLOOMBERG: NOVEMBER 2012 TRADERS’ TIPS CODE
In “Identify The Start Of A Trend With DMI” in this issue, author BC Low uses the DMI indicator and its three output lines to help identify overall trend beginning and ending points. The ADX output of the DMI measures trend strength without any directional bias; that is, high values will indicate a strong trend in either direction.
The DMI+ and DMI- outputs also measure the trend strength, but are used in determining direction of a move as well. For this example, we provide a chart (Figure 4) using the ADX outputs as described by Low, with the three periods defaulting to three, four, and five bars. This example uses a generic front-month crude oil contract adjusted for rolls over time. The indicator is written with the DMI+ and DMI- output lines also available, but defaulted as hidden.
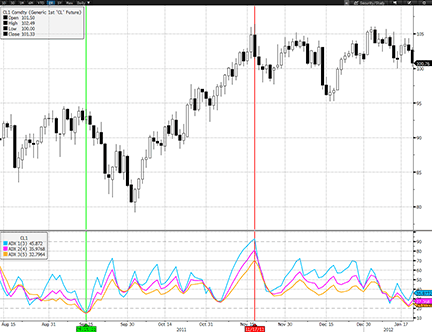
FIGURE 4: BLOOMBERG. Here is a daily bar chart showing CL price movement from mid-August 2011 through mid-January 2012. The study panel below the price chart shows the TAC DMI indicator for ADX lines. The horizontal annotations through the price and study panels mark the bars where some degree of clustering of the ADX lines occur. Per the article’s author, these bars represent points at which a trend should begin (9/15/2011) and another where a subsequent trend will end (11/17/2011).
In Low’s article, he states that the inflection points of the trend will show when all three lines “cluster” at high values (over 70 and 90 for the end of trends, under 30 and 20 for trend initiation). In the chart in Figure 4, we see an example of this on September 15, 2011, when the three values are within one point of each other, clustered below the extreme value of 20. This cluster immediately preceded the move down with a bottom under $80/barrel.
The ensuing start of the uptrend did not see this same clustering, but we can see that all three lines peaked on November 17, 2011, with values from 70 to above 90. While not a complete “cluster” as had occurred at the extreme low values, this alignment at extreme levels was an excellent sign of a change to come.
Using the CS.NET framework within the STDY<GO> function on the Bloomberg Terminal, C# or Visual Basic code can be written to display the TAC DMI described here. The C# code for this indicator is shown below. All Bloomberg code contributions to Traders’ Tips can also be found in the sample files provided with regular SDK updates, and the studies will be included in the Bloomberg global study list.
TAC DMI Code

using System;
using System.Collections.Generic;
using System.Text;
using System.Drawing;
using Bloomberg.Study.API;
using Bloomberg.Study.CoreAPI;
using Bloomberg.Study.Util;
using Bloomberg.Study.TA;
using Bloomberg.Math;

namespace TAC_DMI
{

    public partial class TAC_DMI
    {
        //Create user changeable length parameters for the 3 ADX's defaulted per the author
        public StudyIntegerProperty Period1 = new StudyIntegerProperty(3);
        public StudyIntegerProperty Period2 = new StudyIntegerProperty(4);
        public StudyIntegerProperty Period3 = new StudyIntegerProperty(5);

        private void Initialize()
        {
            //Create a study panel to display the indicator lines
            Panels.Add("ADXPanel", new StudyPanel());

            //Create ADX lines to be output for each time period
            Output.Add("ADX 1", new TimeSeries());
            StudyLine adx1 = new StudyLine("ADX 1", Color.DeepSkyBlue);
            adx1.Style = LineStyle.Solid;
            adx1.Width = 2;
            adx1.DisplayName = "ADX 1";
            adx1.SetDisplayNameSuffix(Period1);
            Panels["ADXPanel"].Visuals.Add("ADX 1", adx1);

            Output.Add("ADX 2", new TimeSeries());
            StudyLine adx2 = new StudyLine("ADX 2", Color.Magenta);
            adx2.Style = LineStyle.Solid;
            adx2.Width = 2;
            adx2.DisplayName = "ADX 2";
            adx2.SetDisplayNameSuffix(Period2);
            Panels["ADXPanel"].Visuals.Add("ADX 2", adx2);

            Output.Add("ADX 3", new TimeSeries());
            StudyLine adx3 = new StudyLine("ADX 3", Color.Orange);
            adx3.Style = LineStyle.Solid;
            adx3.Width = 2;
            adx3.DisplayName = "ADX 3";
            adx3.SetDisplayNameSuffix(Period3);
            Panels["ADXPanel"].Visuals.Add("ADX 3", adx3);

            //DMI+ and DMI- lines are created, but defaulted to be hidden by setting Visible to false
            Output.Add("DMIP 1", new TimeSeries());
            StudyLine dmiP1 = new StudyLine("DMIP 1", Color.DeepSkyBlue);
            dmiP1.Style = LineStyle.Dash;
            dmiP1.Width = 1;
            dmiP1.DisplayName = "DMI+ 1";
            dmiP1.SetDisplayNameSuffix(Period1);
            dmiP1.Visible = false;
            Panels["ADXPanel"].Visuals.Add("DMIP 1", dmiP1);

            Output.Add("DMIP 2", new TimeSeries());
            StudyLine dmiP2 = new StudyLine("DMIP 2", Color.Magenta);
            dmiP2.Style = LineStyle.Dash;
            dmiP2.Width = 1;
            dmiP2.DisplayName = "DMI+ 2";
            dmiP2.SetDisplayNameSuffix(Period2);
            dmiP2.Visible = false;
            Panels["ADXPanel"].Visuals.Add("DMIP 2", dmiP2);

            Output.Add("DMIP 3", new TimeSeries());
            StudyLine dmiP3 = new StudyLine("DMIP 3", Color.Orange);
            dmiP3.Style = LineStyle.Dash;
            dmiP3.Width = 1;
            dmiP3.DisplayName = "DMI+ 3";
            dmiP3.SetDisplayNameSuffix(Period3);
            dmiP3.Visible = false;
            Panels["ADXPanel"].Visuals.Add("DMIP 3", dmiP3);

            Output.Add("DMIN 1", new TimeSeries());
            StudyLine dmiN1 = new StudyLine("DMIN 1", Color.DeepSkyBlue);
            dmiN1.Style = LineStyle.Dot;
            dmiN1.Width = 1;
            dmiN1.DisplayName = "DMI- 1";
            dmiN1.SetDisplayNameSuffix(Period1);
            dmiN1.Visible = false;
            Panels["ADXPanel"].Visuals.Add("DMIN 1", dmiN1);

            Output.Add("DMIN 2", new TimeSeries());
            StudyLine dmiN2 = new StudyLine("DMIN 2", Color.Magenta);
            dmiN2.Style = LineStyle.Dot;
            dmiN2.Width = 1;
            dmiN2.DisplayName = "DMIN 2";
            dmiN2.SetDisplayNameSuffix(Period2);
            dmiN2.Visible = false;
            Panels["ADXPanel"].Visuals.Add("DMIN 2", dmiN2);

            Output.Add("DMIN 3", new TimeSeries());
            StudyLine dmiN3 = new StudyLine("DMIN 3", Color.LawnGreen);
            dmiN3.Style = LineStyle.Dot;
            dmiN3.Width = 1;
            dmiN3.DisplayName = "DMI- 3";
            dmiN3.SetDisplayNameSuffix(Period3);
            dmiN3.Visible = false;
            Panels["ADXPanel"].Visuals.Add("DMIN 3", dmiN3);

            //Create static horizontal lines to show different trend strength levels
            StudyHorizontalLine StrongTrend = new StudyHorizontalLine(70, Color.Gray, VisualLineStyle.Solid);
            Panels["ADXPanel"].Visuals.Add("Strong", StrongTrend);
            StudyHorizontalLine ExStrongTrend = new StudyHorizontalLine(90, Color.Gray, VisualLineStyle.Dash);
            Panels["ADXPanel"].Visuals.Add("Extremely Strong", ExStrongTrend);
            StudyHorizontalLine WeakTrend = new StudyHorizontalLine(30, Color.Gray, VisualLineStyle.Solid);
            Panels["ADXPanel"].Visuals.Add("Weak", WeakTrend);
            StudyHorizontalLine TrendLess = new StudyHorizontalLine(20, Color.Gray, VisualLineStyle.Dash);
            Panels["ADXPanel"].Visuals.Add("Trendless", TrendLess);

        }


        public override void Calculate()
        {
            //Create TimeSeries high, low, close from security data
            TimeSeries high = Input.High;
            TimeSeries low = Input.Low;
            TimeSeries close = Input.Close;

            //Establish TimeSeries results from 3 different period ADX calculations
            DMI ADX1 = Indicator.DMI(high, low, close, Period1.Value);
            DMI ADX2 = Indicator.DMI(high, low, close, Period2.Value);
            DMI ADX3 = Indicator.DMI(high, low, close, Period3.Value);

//Update the output of all lines using the line names from Initialize combined with the available //indicator outputs
            Output.Update("ADX 1", ADX1.ADX);
            Output.Update("ADX 2", ADX2.ADX);
            Output.Update("ADX 3", ADX3.ADX);
            Output.Update("DMIP 1", ADX1.PlusDMI);
            Output.Update("DMIP 2", ADX2.PlusDMI);
            Output.Update("DMIP 3", ADX3.PlusDMI);
            Output.Update("DMIN 1", ADX1.MinusDMI);
            Output.Update("DMIN 2", ADX2.MinusDMI);
            Output.Update("DMIN 3", ADX3.MinusDMI);

        }

    }

}
—Bill Sindel
Bloomberg, LP
wsindel@bloomberg.net
BACK TO LIST

WEALTH-LAB: NOVEMBER 2012 TRADERS’ TIPS CODE
This month’s trading idea is based on tracking market exhaustion patterns
and acting when they reverse in the opposite direction. The idea of using a
cluster of indicators with multiple periods, as discussed in “Identify
The Start Of A Trend With DMI” by BC Low in this issue, may not be
a breakthrough per se; for example, it’s found in systems using multiple
moving averages (MMAs), such as rainbow charts and the Guppy MMA.
A common trait that MMAs share with TAC-DMI clusters is that when indicators within a group are moving close together, the group is largely in agreement. One of the differences in Low’s technique is that a new trend starts when signaled by TAC-DMI clusters converging at an extreme and then reversing as a group. Meanwhile, multiple moving averages tend to expand as a group, following a change in price direction.
As this month’s Wealth-Lab strategy code [shown below] illustrates, the convergence pattern of triple ADX, DI+ or DI- can be formalized fairly easily in WealthScript. Our “convergence” routine with configurable thresholds highlights each of the four events on a chart triggered by combining the triple DI+/DI- and ADX clusters: possible start of uptrends and downtrends, topping, and bottoming out. Motivated traders can reuse the code, possibly enhancing their own systems with timely setups aimed at identification of the start of a trending move and top/bottom-picking.
C# Code:

using System;
using System.Collections.Generic;
using System.Text;
using System.Drawing;
using WealthLab;
using WealthLab.Indicators;

namespace WealthLab.Strategies
{
	public class TAC_DMI_Strategy : WealthScript
	{
		#region Convergence functions

		double Average(List<double> lst)
		{
			double total = 0.0;
			double average = 0.0;
			int period = lst.Count;

			if( period > 0 )
			{
				for (int x = 0; x < period; x++)
					total += lst[x];
				 average = total / period;
			}

			return average;
		}

		bool Convergence(List<double> lst, double scatter, double threshold, bool greater)
		{
			bool result = false;

			if( lst.Count > 0 )
			{
				lst.Sort();
				double first = lst[0];
				double last = lst[lst.Count-1];
				double average = Average(lst);
				double diff = last - first;
				double pct = diff / average * 100;

				if( !double.IsInfinity(average))
				{
					if( greater )
						result = ( (first >= threshold && last >= threshold) && pct <= scatter );
					else
						result = ( (first <= threshold && last <= threshold) && pct <= scatter );
				}
			}

			return result;
		}

		#endregion

		private StrategyParameter paramADXThDn;
		private StrategyParameter paramADXThUp;

		public TAC_DMI_Strategy()
		{
			paramADXThDn = CreateParameter("ADX Up.Th.", 70, 70, 90, 10);
			paramADXThUp = CreateParameter("ATR Lo.Th.", 30, 10, 30, 10);
		}

		protected override void Execute()
		{
			#region DataSeries

			ADX adx4 = ADX.Series(Bars,4);
			ADX adx5 = ADX.Series(Bars,5);
			ADX adx6 = ADX.Series(Bars,6);
			DIPlus dip5 = DIPlus.Series(Bars,5);
			DIPlus dip8 = DIPlus.Series(Bars,8);
			DIPlus dip14 = DIPlus.Series(Bars,14);
			DIMinus dim5 = DIMinus.Series(Bars,5);
			DIMinus dim8 = DIMinus.Series(Bars,8);
			DIMinus dim14 = DIMinus.Series(Bars,14);
			LineStyle ls = LineStyle.Solid;

			#endregion

			#region Plotting

			ChartPane adxPane = CreatePane(35,true,true);
			PlotSeries(adxPane,adx4,Color.Purple,ls,1);
			PlotSeries(adxPane,adx5,Color.Green,ls,1);
			PlotSeries(adxPane,adx6,Color.Violet,ls,1);
			DrawHorzLine(adxPane,30,Color.Blue,LineStyle.Dashed,1);
			DrawHorzLine(adxPane,70,Color.Red,LineStyle.Dashed,1);
			ChartPane dipPane = CreatePane(35,true,true);
			PlotSeries(dipPane,dip5,Color.Purple,ls,1);
			PlotSeries(dipPane,dip8,Color.Green,ls,1);
			PlotSeries(dipPane,dip14,Color.Violet,ls,1);
			DrawHorzLine(dipPane,50,Color.Red,LineStyle.Dashed,1);
			DrawHorzLine(dipPane,10,Color.Black,LineStyle.Dashed,1);
			DrawHorzLine(dipPane,50,Color.Black,LineStyle.Dashed,1);
			ChartPane dimPane = CreatePane(35,true,true);
			PlotSeries(dimPane,dim5,Color.Purple,ls,1);
			PlotSeries(dimPane,dim8,Color.Green,ls,1);
			PlotSeries(dimPane,dim14,Color.Violet,ls,1);
			DrawHorzLine(dimPane,50,Color.Red,LineStyle.Dashed,1);
			DrawHorzLine(dimPane,10,Color.Black,LineStyle.Dashed,1);
			DrawHorzLine(dimPane,50,Color.Black,LineStyle.Dashed,1);
			HideVolume();
			Font font = new Font("Arial", 12, FontStyle.Bold);

			#endregion Plotting

			for(int bar = GetTradingLoopStartBar(14 * 3); bar < Bars.Count; bar++)
			{
				List<double> lstADX =
					new List<double>() { adx4[bar-1],adx5[bar-1],adx6[bar-1] };
				List<double> lstDIP =
					new List<double>() { dip5[bar-1],dip8[bar-1],dip14[bar-1] };
				List<double> lstDIM =
					new List<double>() { dim5[bar-1],dim8[bar-1],dim14[bar-1] };

				bool adxConvergingUp = Convergence( lstADX, 10, paramADXThUp.ValueInt, false );
				bool adxConvergingDown = Convergence( lstADX, 10, paramADXThDn.ValueInt, true );
				bool adxTurnup = TurnUp(bar, adx4) && TurnUp(bar, adx5) && TurnUp(bar, adx6);
				bool adxTurndown = TurnDown(bar, adx4) && TurnDown(bar, adx5) && TurnDown(bar, adx6);
				bool dipTurnup = TurnUp(bar, dip5) && TurnUp(bar, dip8) && TurnUp(bar, dip14);
				bool dimTurnup = TurnUp(bar, dim5) && TurnUp(bar, dim8) && TurnUp(bar, dim14);

				// Signal 1: start of an uptrend

				if( adxConvergingUp && adxTurnup )
				{
					SetBackgroundColor( bar, Color.FromArgb( 20, Color.Green ) );
					AnnotateBar( "Possible uptrend start", bar, true,
						Color.Green, Color.Transparent, font );
					//BuyAtMarket(bar + 1, "Signal-1-Long");
				}

				// Signal 2: start of an uptrend

				if( adxConvergingDown && adxTurndown )
				{
					SetBackgroundColor( bar, Color.FromArgb( 20, Color.Red ) );
					AnnotateBar( "Possible downtrend start", bar, true, Color.Red,
						Color.Transparent, font );
					//ShortAtMarket(bar + 1, "Signal-2-Short");
				}

				// Signal 3: market bottom (DI+/ADX cluster reversal)

				if( adxConvergingDown && Average(lstDIP) <= 10 && dipTurnup )
				{
					SetBackgroundColor( bar, Color.FromArgb( 40, Color.Green ) );
					AnnotateBar( "Possible bottom", bar, true, Color.Green,
						Color.Transparent, font );
					//BuyAtMarket(bar + 1, "Signal-3-Long");
				}

				// Signal 4: market top (DI-/ADX cluster reversal)

				if( adxConvergingDown && Average(lstDIM) <= 10 && dimTurnup )
				{
					SetBackgroundColor( bar, Color.FromArgb( 40, Color.Red ) );
					AnnotateBar( "Possible top", bar, true, Color.Red,
						Color.Transparent, font );
					//ShortAtMarket(bar + 1, "Signal-4-Short");
				}
			}
		}
	}
}
A sample Wealth-Lab chart is shown in Figure 5.
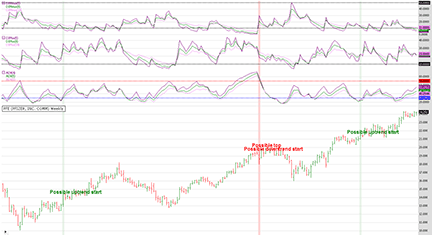
Figure 5: WEALTH-LAB. Here is a weekly chart of PFE (Pfizer) illustrating the application of the TAC-DMI approach.
—Eugene, MS123, LLC
www.wealth-lab.com
BACK TO LIST

AMIBROKER: NOVEMBER 2012 TRADERS’ TIPS CODE
In “Identify The Start Of A Trend With DMI” in this issue, author BC Low discusses how to use short-term ADX indicator clusters to identify market tops and bottoms. His technique uses just three short-term ADX (average directional movement) indicators with periods equal to three, four, and five bars.
A ready-to-use AmiBroker formula for the indicator is shown below. To display the indicator, simply input the formula into the formula editor and press “Apply indicator.”
A sample chart implementation is shown in Figure 6.
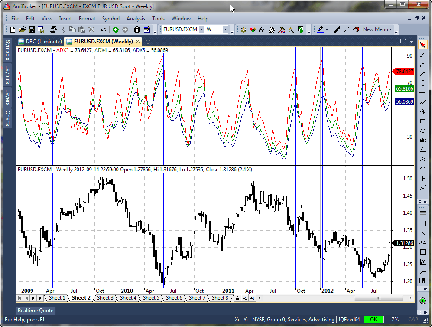
FIGURE 6: AMIBROKER, WEEKLY EUR/USD CHART WITH ADX CLUSTERS. The 3x ADX clusters peaking above 70 and turning down mark the end of the move. A new trend begins when they converge below 30 and turn up.
Plot( ADX(3), "ADX3", colorRed );
Plot( ADX(4), "ADX4", colorGreen );
Plot( ADX(5), "ADX5", colorDarkBlue);
—Tomasz Janeczko, AmiBroker.com
www.amibroker.com
BACK TO LIST

NEUROSHELL TRADER: NOVEMBER 2012 TRADERS’ TIPS CODE
The directional movement clusters and corresponding signals described by BC Low in his article in this issue, “Identify The Start Of A Trend With DMI,” can be easily implemented with a few of NeuroShell Trader’s 800+ indicators along with our Advanced Indicator Set #2. Simply select “New indicator” from the Insert menu and use the Indicator Wizard to set up the following indicators:
Triple ADX Cluster (ADX3, ADX4 & ADX5):
ADX( High, Low, Close, 3, 3 )
ADX( High, Low, Close, 4, 4 )
ADX( High, Low, Close, 5, 5 )

Triple +DI Cluster (+DI5, +DI8 & +DI14):
PlusDI( High, Low, Close, 5 )
PlusDI( High, Low, Close, 8 )
PlusDI( High, Low, Close, 14 )

Triple -DI Cluster (-DI5, -DI8, -DI14):
MinusDI( High, Low, Close, 5 )
MinusDI( High, Low, Close, 8 )
MinusDI( High, Low, Close, 14 )

Signal 1: Start of a trend when 3x ADX cluster converges below 30:
And3( 	A<B( Lag( Max3( ADX3, ADX4, ADX5), 1), 30 ),
	A<B( Lag( Sub( Max3( ADX3, ADX4, ADX5), Min3( ADX3, ADX4, ADX5)),1), 5 ),
	A>B( Min3( Change(ADX3,1), Change(ADX4,1), Change(ADX5,1) ), 0 ) )

Signal 2: End of a move when 3x ADX cluster turns down above 70
And2( 	A>B( Lag( ADX3, 1), 70 ),
    A<B( Max3( Change(ADX3,1), Change(ADX4,1), Change(ADX5,1) ), 0 ) )

Signal 3: Signaling market bottom with +DI at Level 5
And2( 	A<=B( Lag( +DI5, 1), 5 ),
	A>B( Min3( Change(+DI5,1), Change(+DI8,1), Change(+DI14,1) ), 0 ) )

Signal 3b: Signaling market bottom by combining 3x +DI cluster with 3x ADX cluster
And4( 	A>=B( Lag( ADX3, 1), 90 ),
	A<B( Max3( Change(ADX3,1), Change(ADX4,1), Change(ADX5,1) ), 0 ),
	A<=B( Lag( +DI3, 1), 5 ),
	A>B( Min3( Change(+DI5,1), Change(+DI8,1), Change(+DI14,1) ), 0 ) )

Signal 4: Signaling market top with -DI at level 5
And2( 	A<=B( Lag( -DI5, 1), 5 ),
	A>B( Min3( Change(-DI5,1), Change(-DI8,1), Change(-DI14,1) ), 0 ) )

Signal 4b: Signaling market top by combining -3x ADX cluster with 3x ADX cluster
And4( 	A>=B( Lag( ADX3, 1), 90 ),
	A<B( Max3( Change(ADX3,1), Change(ADX4,1), Change(ADX5,1) ), 0 ),
	A<=B( Lag( -DI5, 1), 5 ),
	A>B( Min3( Change(-DI5,1), Change(-DI8,1), Change(-DI14,1) ), 0 ) )
Users of NeuroShell Trader can go to the Stocks & Commodities section of the NeuroShell Trader free technical support website to download a copy of this or any previous Traders’ Tip.
A sample chart is shown in Figure 7.
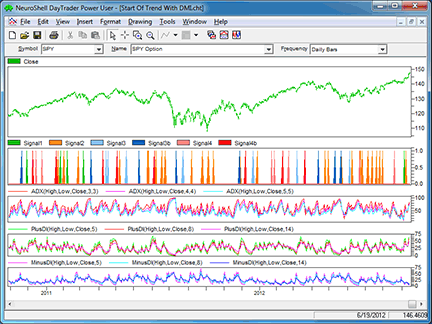
FIGURE 7: NEUROSHELL TRADER. This NeuroShell Trader chart displays the DMI clusters and signals.
—Marge Sherald
Ward Systems Group, Inc.
301 662-7950, sales@wardsystems.com
www.neuroshell.com
BACK TO LIST

AIQ: NOVEMBER 2012 TRADERS’ TIPS CODE
The AIQ code based on BC Low’s article in this issue, “Identify The Start Of A Trend With DMI,” is provided at the following website: www.TradersEdgeSystems.com/traderstips.htm, and is shown below.
Several of the terms used by the author had to be interpreted to be converted into signal code such as, “cluster drifts down below level 30,” “converging,” “turning up,” and so on. My interpretation may differ from what the author intended, and other interpretations are possible. In addition, I had to come up with exits for the signals as none were given. In testing using the NASDAQ 100 list of stocks, the long-only system was profitable over the test period, whereas I could not get the short-only system to be profitable.
To test the author’s 3x DMI system, I used the NASDAQ 100 list of stocks and AIQ’s Portfolio Manager. A long-only trading simulation was run with the following capitalization, cost, and exit settings:
- Maximum of 10 open positions
- Size each position at 10 % of mark-to-market total capital
- Take no more than three new positions per day
- Compute the mark-to-market capital each day
- Three cents per share was deducted for each round-turn trade
- Select trades based on the highest 14-bar ADX reading
- Exit trades if the end-of-day stop-loss exceeds 3%
- Exit trades by protecting 50% of profits once profit level reaches 10%.
In Figure 8, I show the resulting statistics and long-only equity curve compared to the NASDAQ 100 index. For the period 12/31/1999 to 9/17/2012, the system returned an average internal rate of return of 20.7% with a maximum drawdown of 58.2% on 3/9/2009.
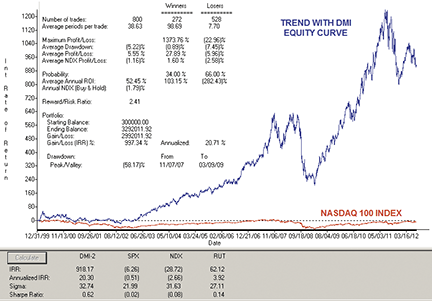
FIGURE 8: AIQ, EQUITY CURVE. This long-only equity curve is compared to the NASDAQ 100 for the test period 12/31/1999 to 9/17/2012 trading the NASDAQ 100 list of stocks.
!IDENTIFY THE START OF A TREND WITH DMI
!Author: BC Low, TASC Nov 2012
!Coded by: Richard Denning 09/17/12
!www.TradersEdgeSystems.com

!INPUTS:
   wLen is 14.
   wLen3 is 3.
   wLen4 is 4.
   wLen5 is 5.
   wLen8 is 8.
   blvl is 30.
   slvl is 70.

!CODING ABREVIATIONS:
   H is [high].
   L is [low].
   C is [close].
   C1 is valresult(C,1).
   H1 is valresult(H,1).
   L1 is valresult(L,1).

!NOTE: Wilder to expontential averaging the formula is:
!  Wilder length * 2 - 1 = exponential averaging length
   eLen is wLen * 2 - 1.
   eLen3 is wLen3 * 2 - 1.
   eLen4 is wLen4 * 2 - 1.
   eLen5 is wLen5 * 2 - 1.
   eLen8 is wLen8 * 2 - 1.

!AVERAGE TRUE RANGE:
   TR  is Max(H-L,max(abs(C1-L),abs(C1-H))).
   ATR  is expAvg(TR,eLen).
   ATR3  is expAvg(TR,eLen3).
   ATR4  is expAvg(TR,eLen4).
   ATR5  is expAvg(TR,eLen5).
   ATR8  is expAvg(TR,eLen8).

!+DM -DM CODE:
   rhigh is (H-H1).
   rlow is (L1-L).
   DMplus is iff(rhigh > 0 and rhigh > rlow, rhigh, 0).
   DMminus is iff(rlow > 0 and rlow >= rhigh, rlow, 0).

   AvgPlusDM is expAvg(DMplus,eLen).
   AvgPlusDM3 is expAvg(DMplus,eLen3).
   AvgPlusDM4 is expAvg(DMplus,eLen4).
   AvgPlusDM5 is expAvg(DMplus,eLen5).
   AvgPlusDM8 is expAvg(DMplus,eLen8).

   AvgMinusDM is expavg(DMminus,eLen).
   AvgMinusDM3 is expavg(DMminus,eLen3).
   AvgMinusDM4 is expavg(DMminus,eLen4).
   AvgMinusDM5 is expavg(DMminus,eLen5).
   AvgMinusDM8 is expavg(DMminus,eLen8).

!DMI CODE:
   PlusDMI is (AvgPlusDM/ATR)*100.
   PlusDMI3 is (AvgPlusDM3/ATR)*100.
   PlusDMI4 is (AvgPlusDM4/ATR)*100.
   PlusDMI5 is (AvgPlusDM5/ATR)*100.
   PlusDMI8 is (AvgPlusDM8/ATR)*100.

   MinusDMI is AvgMinusDM/ATR*100.
   MinusDMI3 is AvgMinusDM3/ATR*100.
   MinusDMI4 is AvgMinusDM4/ATR*100.
   MinusDMI5 is AvgMinusDM5/ATR*100.
   MinusDMI8 is AvgMinusDM8/ATR*100.

!ADX INDICATOR as defined by Wells Wilder
   DIdiff is PlusDMI-MinusDMI.
   ZERO if PlusDMI = 0 and MinusDMI =0.
   DIsum is PlusDMI+MinusDMI.
   DX is iff(ZERO,100,abs(DIdiff)/DIsum*100).
   ADX is ExpAvg(DX,eLen).

   DIdiff3 is PlusDMI3-MinusDMI3.
   ZERO3 if PlusDMI3 = 0 and MinusDMI3 =0.
   DIsum3 is PlusDMI3+MinusDMI3.
   DX3 is iff(ZERO3,100,abs(DIdiff3)/DIsum3*100).
   ADX3 is ExpAvg(DX3,eLen3).

   DIdiff4 is PlusDMI4-MinusDMI4.
   ZERO4 if PlusDMI4 = 0 and MinusDMI4 =0.
   DIsum4 is PlusDMI4+MinusDMI4.
   DX4 is iff(ZERO4,100,abs(DIdiff4)/DIsum4*100).
   ADX4 is ExpAvg(DX4,eLen4).

   DIdiff5 is PlusDMI5-MinusDMI5.
   ZERO5 if PlusDMI5 = 0 and MinusDMI5 =0.
   DIsum5 is PlusDMI5+MinusDMI5.
   DX5 is iff(ZERO5,100,abs(DIdiff5)/DIsum5*100).
   ADX5 is ExpAvg(DX5,eLen5).

!TRADING SYSTEM CODE:
   Converge if (ADX3 < ADX4 Or ADX3 < ADX5) and ADX4 < ADX5.
   Below if ADX3 < blvl And ADX4 < blvl And ADX5 < blvl.
   TurnUp if  ADX3 > ADX4 And ADX3 > ADX5 And ADX4 > ADX5.
   Peak if (ADX3 > ADX4 Or ADX3 > ADX5) And ADX4 > ADX5.
   Above if ADX3 > slvl And ADX4 > slvl And ADX5 > slvl.
   TurnDn if ADX3 < ADX4 And ADX3 < ADX5 And ADX4 < ADX5.
   PlusBottom if PlusDMI5 <= 5 And PlusDMI8 <= 10 And PlusDMI <= 10.
   AbovePlus if ADX3 > Min(slvl+20,90).
   PlusUp if PlusDMI5 > PlusDMI8 And PlusDMI5 > PlusDMI And PlusDMI8 > PlusDMI.
   MinusBottom if MinusDMI5 <= 5 And MinusDMI8 <= 10 And MinusDMI <= 10.
   MinusUp if MinusDMI5 > MinusDMI8 And MinusDMI5 > MinusDMI And MinusDMI8 > MinusDMI.

   BuySig1 if countof(Below,5,0)>=1 And countof(Converge,5,0)>=1 And TurnUp.
   SellSig2 if countof(Above,5,0)>=1 And countof(Peak,5,0)>=1 And TurnDn.
   BuySig3 if countof(PlusBottom,5,0)>=1 And countof(AbovePlus,5,0)>=1 And TurnDn And PlusUp.
   SellSig4 if countof(MinusBottom,5,0)>=1 And countof(AbovePlus,5,0)>=1 And TurnDn And MinusUp.

   Buy if BuySig1 or BuySig3.
   Sell if SellSig2 or SellSig4.
—Richard Denning
info@TradersEdgeSystems.com
for AIQ Systems
BACK TO LIST

TRADERSSTUDIO: NOVEMBER 2012 TRADERS’ TIPS CODE
The TradersStudio code based on BC Low’s article in this issue, “Identify The Start Of A Trend With DMI,” is provided at the following websites:
The code is also shown below. The following code files are provided in the download:
- Indicator plot: “THREE_ADS_IND” for plotting the 3x ADX indicator
- Indicator plot: “THREE_DMIplus_IND” for plotting the 3x DMIplus indicator
- Indicator plot: “THREE_DMIminus_IND” for plotting the 3x DMIminus indicator
- Function: “COUNTOF” is a helper function that returns the number of times a rule is true
- System: “THREE_ADX” is my interpretation of the author’s description of the four entry signal types. Exits are of my design and parameters were adjusted based on optimization.
Several of the terms used by Low had to be interpreted to be converted into signal code such as “cluster drifts down below level 30,” “converging,” “turning up,” and so on. My interpretation might differ from what the author intended and other interpretations are possible. In addition, I had to come up with exits for the signals, as none were given.
I tested using a portfolio of currency futures contacts using Pinnacle data. The following symbols were used: AN, BN, CN, FN, JN, and EC. I also used trade-plan code “PCTMARGINPLAN” that is provided with TradersStudio software, with the percent set to 10% to come up with the log equity and underwater equity curves shown in Figure 9.
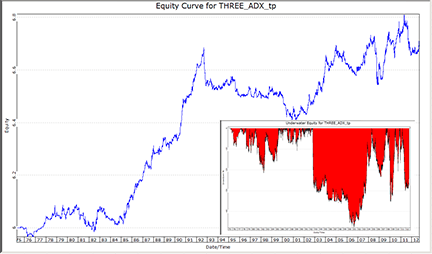
FIGURE 9: TRADERSSTUDIO, EQUITY CURVES. Here are sample log equity and underwater equity curves for a currency futures basket from 1975 to 2012.
For the test period of 2/13/1975 to 9/14/2012, the system, which trades both long and short, showed an average return of 11% with a maximum drawdown of 48%. Of the 38 years in the test, 22 were profitable.
'IDENTIFY THE START OF A TREND WITH DMI
'Author: BC Low, TASC Nov 2012
'Coded by: Richard Denning 09/16/12
'www.TradersEdgeSystems.com

Sub THREE_ADX_IND(len1,len2,len3)
'len1=3,len2=4,len3=5
plot1(adx(len1,0))
plot2(adx(len2,0))
plot3(adx(len3,0))
plot4(90)
plot5(70)
plot6(30)
plot7(20)
End Sub
'--------------------------------------------
Sub THREE_DMIminus_IND(len1,len2,len3)
'len1=5,len2=8,len3=14
plot1(DMIMINUS(len1,0))
plot2(DMIMINUS(len2,0))
plot3(DMIMINUS(len3,0))
plot4(50)
plot5(5)
End Sub
'---------------------------------------------
Sub THREE_DMIplus_IND(len1,len2,len3)
'len1=5,len2=8,len3=14
plot1(DMIPLUS(len1,0))
plot2(DMIPLUS(len2,0))
plot3(DMIPLUS(len3,0))
plot4(50)
plot5(5)
End Sub
'---------------------------------------------
'COUNTOF Function
'returns how many times a rule is true in the lookback length
'coded by Richard Denning 01/04/08

Function COUNTOF(rule As BarArray, countLen As Integer, offset As Integer)
Dim count As Integer
Dim counter As Integer
    For counter = 0 + offset To countLen + offset - 1
        If rule[counter] Then
            count = count + 1
        End If
    Next
COUNTOF = count
End Function
'---------------------------------------------
Sub THREE_ADX(blvl,slvl,xblvl,xslvl,maxBars)
'blvl=20,slvl=70,xblvl=80,xslvl=40
'maxBars=15
dim len1,len2,len3,len4,len5,len6
Dim theADX1 As BarArray
Dim theADX2 As BarArray
Dim theADX3 As BarArray
Dim theDMIplus1 As BarArray
Dim theDMIplus2 As BarArray
Dim theDMIplus3 As BarArray
Dim theDMIminus1 As BarArray
Dim theDMIminus2 As BarArray
Dim theDMIminus3 As BarArray
Dim converge As BarArray
Dim below As BarArray
Dim turnUp,turnDn,xlong,xshort
Dim peak As BarArray
Dim peakMinus As BarArray
Dim above As BarArray
Dim abovePlus As BarArray
Dim plusBottom As BarArray
Dim plusUp As BarArray
Dim minusBottom As BarArray
Dim minusUp As BarArray
Dim sma As BarArray
len1=3
len2=4
len3=5
len4=5
len5=8
len6=14
theADX1 = adx(len1,0)
theADX2 = adx(len2,0)
theADX3 = adx(len3,0)
theDMIplus1 = dmiplus(len4,0)
theDMIplus2 = dmiplus(len5,0)
theDMIplus3 = dmiplus(len6,0)
theDMIminus1 = dmiminus(len4,0)
theDMIminus2 = dmiminus(len5,0)
theDMIminus3 = dmiminus(len6,0)
sma = Average(C,50)
converge = (theADX1 < theADX2 Or theADX1 < theADX3) And theADX2 < theADX3
below = theADX1 < blvl And theADX2 < blvl And theADX3 < blvl
xlong = theADX1 > xslvl And theADX2 > xslvl And theADX3 > xslvl
turnUp =  theADX1 > theADX2 And theADX1 > theADX3 And theADX2 > theADX3
peak = (theADX1 > theADX2 Or theADX1 > theADX3) And theADX2 > theADX3
above = theADX1 > slvl And theADX2 > slvl And theADX3 > slvl
xshort = theADX1 < xblvl And theADX2 < xblvl And theADX3 < xblvl
turnDn = theADX1 < theADX2 And theADX1 < theADX3 And theADX2 < theADX3

If countof(below,5,0)>=1 And countof(converge,5,0)>=1 And turnUp Then Buy("Signal 1",1,0,Market,Day)
'If xlong Then ExitLong("Signal 1x","Signal 1",1,0,Market,Day)
If countof(above,5,0)>=1 And countof(peak,5,0)>=1 And turnDn Then Sell("Signal 2",1,0,Market,Day)
If xshort Then ExitShort("Signal 2x","Signal 2",1,0,Market,Day)

plusBottom = theDMIplus1 <= 5 And theDMIplus2 <= 10 And theDMIplus3 <= 10
abovePlus = theADX1 > Min(slvl+20,90)
plusUp = theDMIplus1 > theDMIplus2 And theDMIplus1 > theDMIplus3 And theDMIplus2 > theDMIplus3
minusBottom = theDMIminus1 <= 5 And theDMIminus2 <= 10 And theDMIminus3 <= 10
minusUp = theDMIminus1 > theDMIminus2 And theDMIminus1 > theDMIminus3 And theDMIminus2 > theDMIminus3
If countof(plusBottom,5,0)>=1 And countof(abovePlus,5,0)>=1 And turnDn And plusUp Then Buy("Signal 3",1,0,Market,Day)
If  (sma < sma[10] And sma[1] > sma[11]) Or (BarsSinceEntry >= maxBars And sma < sma[10]) Then ExitLong("Signal 3x","",1,0,Market,Day)
If countof(minusBottom,5,0)>=1 And countof(abovePlus,5,0)>=1 And turnDn And minusUp Then Sell("Signal 4",1,0,Market,Day)
If  (sma > sma[10] And sma[1] < sma[11]) Or (BarsSinceEntry >= maxBars-5 And sma > sma[10]) Then ExitShort("Signal 4x","",1,0,Market,Day)
End Sub
—Richard Denning
info@TradersEdgeSystems.com
for TradersStudio
BACK TO LIST

UPDATA: NOVEMBER 2012 TRADERS’ TIPS CODE
Our Traders’ Tip for this month is based on “Identify The Start Of A Trend With DMI” by BC Low in this issue. In the article, the author creates three indicators based on the three lines associated with Wilder’s directional movement index. The 3x ADX cluster is made up of three short-term ADX lines. The 3x +DI cluster and the 3x -DI cluster are made up of three +DI and three -DI lines, respectively. Signals are generated by convergences and crossings above the 90 level and below the 10 level. A sample chart is shown in Figure 10.
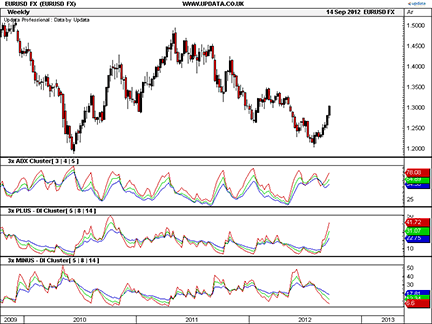
FIGURE 10: UPDATA. The 3x ADX, 3x +DI, and 3x -DI clusters are applied to weekly resolution EUR/USD currency.
The Updata code for this indicator has been entered into the Updata Library and may be downloaded by clicking the Custom menu and then Indicator Library. Those who cannot access the library due to a firewall may paste the code shown below into the Updata Custom editor and then save it.
'TAC-DMI
PARAMETER "ADX Period 1" #ADXPeriod1=3
PARAMETER "ADX Period 2" #ADXPeriod2=4
PARAMETER "ADX Period 3" #ADXPeriod3=5
PARAMETER "[+/-] DI Period 1" #DIPeriod1=5
PARAMETER "[+/-] DI Period 2" #DIPeriod2=8
PARAMETER "[+/-] DI Period 3" #DIPeriod3=14
DISPLAYSTYLE 9LINES
INDICATORTYPE CHART
INDICATORTYPE4 CHART
INDICATORTYPE7 CHART
PLOTSTYLE LINE RGB(200,0,0)
PLOTSTYLE2 LINE RGB(0,200,0)
PLOTSTYLE3 LINE RGB(0,0,200)
PLOTSTYLE4 LINE RGB(200,0,0)
PLOTSTYLE5 LINE RGB(0,200,0)
PLOTSTYLE6 LINE RGB(0,0,200)
PLOTSTYLE7 LINE RGB(200,0,0)
PLOTSTYLE8 LINE RGB(0,200,0)
PLOTSTYLE9 LINE RGB(0,0,200)
NAME "3x ADX Cluster[" #ADXPeriod1 "|" #ADXPeriod2 "|" #ADXPeriod3 "]" ""
NAME4 "3x PLUS-DI Cluster[" #DIPeriod1 "|" #DIPeriod2 "|" #DIPeriod3 "]" ""
NAME7 "3x MINUS-DI Cluster[" #DIPeriod1 "|" #DIPeriod2 "|" #DIPeriod3 "]" ""
@ADX1=0
@ADX2=0
@ADX3=0
@PLUSDI1=0
@PLUSDI2=0
@PLUSDI3=0
@MINUSDI1=0
@MINUSDI2=0
@MINUSDI3=0
FOR #CURDATE=(#DIPeriod1+#DIPeriod2+#DIPeriod3) TO #LASTDATE
   '3x ADX Cluster Lines
   @ADX1=DIRMOV(#ADXPeriod1,ADX)
   @ADX2=DIRMOV(#ADXPeriod2,ADX)
   @ADX3=DIRMOV(#ADXPeriod3,ADX)
   '3x PLUS-DI Cluster Lines
   @PLUSDI1=DIRMOV(#DIPeriod1,PLUSDI)
   @PLUSDI2=DIRMOV(#DIPeriod2,PLUSDI)
   @PLUSDI3=DIRMOV(#DIPeriod3,PLUSDI)
   '3x MINUS-DI Cluster Lines
   @MINUSDI1=DIRMOV(#DIPeriod1,MINUSDI)
   @MINUSDI2=DIRMOV(#DIPeriod2,MINUSDI)
   @MINUSDI3=DIRMOV(#DIPeriod3,MINUSDI)
   @PLOT=@ADX1
   @PLOT2=@ADX2
   @PLOT3=@ADX3
   @PLOT4=@PLUSDI1
   @PLOT5=@PLUSDI2
   @PLOT6=@PLUSDI3
   @PLOT7=@MINUSDI1
   @PLOT8=@MINUSDI2
   @PLOT9=@MINUSDI3
NEXT
—Updata support team
support@updata.co.uk
www.updata.co.uk
BACK TO LIST

NINJATRADER: NOVEMBER 2012 TRADERS’ TIPS CODE
The DMIATS and related indicators, as discussed in “Identify The Start Of A Trend With DMI” by BC Low in this issue, have been implemented as an automated strategy and indicator available for download at www.ninjatrader.com/SC/November2012SC.zip.
Once you have it downloaded, from within the NinjaTrader Control Center window, select the menu File → Utilities → Import NinjaScript and select the downloaded file. This file is for NinjaTrader version 7 or greater.
You can review the strategy source code by selecting the menu Tools → Edit NinjaScript → Strategy from within the Ninja-Trader Control Center window and selecting “DMIATS.”
You can review the indicator source code by selecting the menu Tools → Edit NinjaScript → Indicator from within the NinjaTrader Control Center window and selecting ADXCluster, DMIPlusCluster, and DMIMinusCluster.
A sample chart implementing the strategy is shown in Figure 11.
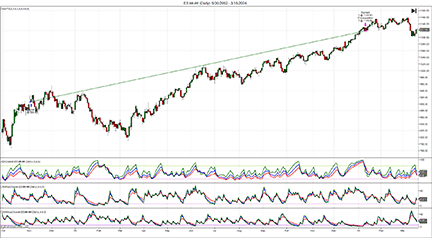
FIGURE 11: NINJATRADER. This screenshot shows the DMIATS and related indicators applied to a daily chart of emini S&P continuous (ES ##-##).
—Raymond Deux and Ryan Millard
NinjaTrader, LLC
www.ninjatrader.com
BACK TO LIST

TRADESIGNAL: NOVEMBER 2012 TRADERS’ TIPS CODE
The indicators discussed in “Identify The Start Of A Trend With DMI” by BC Low in this issue can easily be used with our online charting tool at www.tradesignalonline.com. Just check the Infopedia section for our lexicon. You will see the indicator and the functions, which you can make available for your personal account. Click on it and select “open script.” You can then apply the indicator to any chart you wish (Figure 12).
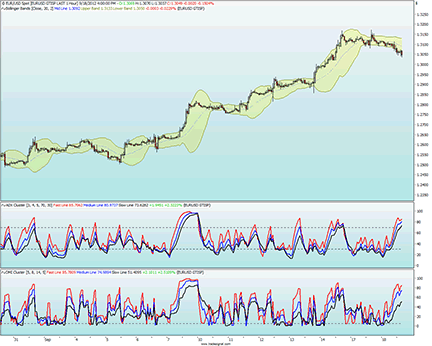
FIGURE 12: Tradesignal Online. Here is a sample TradeSignal Online chart showing the ADX cluster indicator and DMI cluster indicator on the hourly chart of the spot EUR/USD.
The TradeSignal code listing for this technique is shown below.
ADX Cluster.eqi

Meta:
	Synopsis("This indicator is based on the november 2012 article 'Identify The Start Of
			A Trend With DMI' in technical analysis of stocks and commodities."),
	Weblink("https://www.tradesignalonline.com/lexicon/view.aspx?id=18855"),
	Subchart( True );

Inputs:
	Fast_Period( 3 , 1 ),
	Medium_Period( 4 , 1 ),
	Slow_Period( 5 , 1 ),
	Upper_Level( 70 , 1 ),
	Lower_Level( 30 , 1 );

VArs:
	fastADX, mediumADX, slowADX;

fastADX = ADX( Fast_Period );
mediumADX = ADX( Medium_Period );
slowADX = ADX( Slow_Period );

DrawLine( fastADX, "Fast Line", StyleSolid, 2, Red );
DrawLine( mediumADX, "Medium Line", StyleSolid, 2, Blue );
DrawLine( slowADX, "Slow Line", StyleSolid, 2, Black );

DrawLIne( Upper_Level, "Upper Level", StyleDash, 1, Black );
DrawLIne( Lower_Level, "Lower Level", StyleDash, 1, Black );

// *** Copyright tradesignal GmbH ***
// *** www.tradesignal.com ***
DMI Cluster.eqi

Meta:
	Synopsis("This indicator is based on the november 2012 article 'Identify The Start Of
			A Trend With DMI' in technical analysis of stocks and commodities."),
	Weblink("https://www.tradesignalonline.com/lexicon/view.aspx?id=18855"),
	Subchart( True );

Inputs:
	Fast_Period( 5 , 1 ),
	Medium_Period( 8 , 1 ),
	Slow_Period( 14 , 1 ),
	Lower_Level( 5 , 1 );

Vars:
	fastDMI, mediumDMI, slowDMI;

fastDMI = DMI( Fast_Period );
mediumDMI = DMI( Medium_Period );
slowDMI = DMI( Slow_Period );

DrawLine( fastDMI, "Fast Line", StyleSolid, 2, Red );
DrawLine( mediumDMI, "Medium Line", StyleSolid, 2, Blue );
DrawLine( slowDMI, "Slow Line", StyleSolid, 2, Black );

DrawLIne( Lower_Level, "Lower Level", StyleDash, 1, Black );

// *** Copyright tradesignal GmbH ***
// *** www.tradesignal.com ***
—Henning Blumenthal
Tradesignal GmbH
support@tradesignalonline.com
www.TradesignalOnline.com, www.Tradesignal.com
BACK TO LIST

VT TRADER: NOVEMBER 2012 TRADERS’ TIPS CODE
Our Traders’ Tip this month is based on “Identify The Start Of A Trend With DMI” by BC Low in this issue. The TAC-DMI indicator is a modification of Welles Wilder’s directional movement index (DMI). Low’s TAC-DMI consists of clusters of three ADX lines, three +DMI lines, and three -DMI lines. For additional information regarding the use of the TAC-DMI, please refer to the referenced article.
We’ll be offering the TAC-DMI (in a trading system file format for convenience) for download in our VT client forums at https://forum.vtsystems.com along with hundreds of other precoded and free indicators and trading systems. The VT Trader instructions for recreating the analytic template are shown below.
- Ribbon→Technical Analysis menu→Trading Systems group→Trading Systems Builder command→[New] button
- In the General tab, type the following text for each field:
Name: TASC - 11/2012 - TAC-DMI Clusters
Function Name Alias: tasc_TacDmiClusters
Label Mask: TAC-DMI (ADX: %adxsh%,%adxmd%,%adxlg%, DMI: %dmish%,%dmimd%,%dmilg%)
- In the Input Variable(s) tab, create the following variables:
[New] button...
Name: adxsh
Display Name: ADX Short Periods
Type: integer
Default: 3

[New] button...
Name: adxmd
Display Name: ADX Medium Periods
Type: integer
Default: 4

[New] button...
Name: adxlg
Display Name: ADX Long Periods
Type: integer
Default: 5

[New] button...
Name: dmish
Display Name: DMI Short Periods
Type: integer
Default: 5

[New] button...
Name: dmimd
Display Name: DMI Medium Periods
Type: integer
Default: 8

[New] button...
Name: dmilg
Display Name: DMI Long Periods
Type: integer
Default: 14
- In the Output Variable(s) tab, create the following variables:
[New] button...
Var Name: ShortADX
Name: Short ADX
* Checkmark: Indicator Output
Select Indicator Output Tab
Line Color: light green
Line Width: 2
Ling Style: solid
Placement: Additional Frame 1
[OK] button...

[New] button...
Var Name: MediumADX
Name: Medium ADX
* Checkmark: Indicator Output
Select Indicator Output Tab
Line Color: green
Line Width: 2
Ling Style: solid
Placement: Additional Frame 1
[OK] button...

[New] button...
Var Name: LongADX
Name: Long ADX
* Checkmark: Indicator Output
Select Indicator Output Tab
Line Color: dark green
Line Width: 2
Ling Style: solid
Placement: Additional Frame 1
[OK] button...

[New] button...
Var Name: ShortPlusDMI
Name: Short PlusDMI
* Checkmark: Indicator Output
Select Indicator Output Tab
Line Color: light blue
Line Width: 1
Ling Style: solid
Placement: Additional Frame 2
[OK] button...

[New] button...
Var Name: MediumPlusDMI
Name: Medium PlusDMI
* Checkmark: Indicator Output
Select Indicator Output Tab
Line Color: blue
Line Width: 1
Ling Style: solid
Placement: Additional Frame 2
[OK] button...

[New] button...
Var Name: LongPlusDMI
Name: Long PlusDMI
* Checkmark: Indicator Output
Select Indicator Output Tab
Line Color: dark blue
Line Width: 1
Ling Style: solid
Placement: Additional Frame 2
[OK] button...

[New] button...
Var Name: ShortMinusDMI
Name: Short MinusDMI
* Checkmark: Indicator Output
Select Indicator Output Tab
Line Color: light red
Line Width: 1
Ling Style: solid
Placement: Additional Frame 3
[OK] button...

[New] button...
Var Name: MediumMinusDMI
Name: Medium MinusDMI
* Checkmark: Indicator Output
Select Indicator Output Tab
Line Color: red
Line Width: 1
Ling Style: solid
Placement: Additional Frame 3
[OK] button...

[New] button...
Var Name: LongMinusDMI
Name: Long PMinusDMI
* Checkmark: Indicator Output
Select Indicator Output Tab
Line Color: dark red
Line Width: 1
Ling Style: solid
Placement: Additional Frame 3
[OK] button...

[New] button...
Var Name: ADXbasicRLH
Name: ADX basic RLH
* Checkmark: Indicator Output
Select Indicator Output Tab
Line Color: black
Line Width: 1
Ling Style: solid
Placement: Additional Frame 1
[OK] button...

[New] button...
Var Name: ADXbasicRLL
Name: ADX basic RLL
* Checkmark: Indicator Output
Select Indicator Output Tab
Line Color: black
Line Width: 1
Ling Style: solid
Placement: Additional Frame 1
[OK] button...

[New] button...
Var Name: ADXcriticalRLH
Name: ADX critical RLH
* Checkmark: Indicator Output
Select Indicator Output Tab
Line Color: black
Line Width: 1
Ling Style: dashed
Placement: Additional Frame 1
[OK] button...

[New] button...
Var Name: ADXcritalRLL
Name: ADX critical RLL
* Checkmark: Indicator Output
Select Indicator Output Tab
Line Color: black
Line Width: 1
Ling Style: dashed
Placement: Additional Frame 1
[OK] button...

[New] button...
Var Name: PlusDMIbasicRLH
Name: PlusDMI basic RLH
* Checkmark: Indicator Output
Select Indicator Output Tab
Line Color: black
Line Width: 1
Ling Style: solid
Placement: Additional Frame 2
[OK] button...

[New] button...
Var Name: PlusDMIbasicRLL
Name: PlusDMI basic RLL
* Checkmark: Indicator Output
Select Indicator Output Tab
Line Color: black
Line Width: 1
Ling Style: solid
Placement: Additional Frame 2
[OK] button...

[New] button...
Var Name: PlusDMIcriticalRL
Name: PlusDMI critical RL
* Checkmark: Indicator Output
Select Indicator Output Tab
Line Color: black
Line Width: 1
Ling Style: dashed
Placement: Additional Frame 2
[OK] button...

[New] button...
Var Name: MinusDMIbasicRLH
Name: MinusDMI basic RLH
* Checkmark: Indicator Output
Select Indicator Output Tab
Line Color: black
Line Width: 1
Ling Style: solid
Placement: Additional Frame 3
[OK] button...

[New] button...
Var Name: MinusDMIbasicRLL
Name: MinusDMI basic RLL
* Checkmark: Indicator Output
Select Indicator Output Tab
Line Color: black
Line Width: 1
Ling Style: solid
Placement: Additional Frame 3
[OK] button...

[New] button...
Var Name: MinusDMIcriticalRL
Name: MinusDMI critical RL
* Checkmark: Indicator Output
Select Indicator Output Tab
Line Color: black
Line Width: 1
Ling Style: dashed
Placement: Additional Frame 3
[OK] button...
- In the Formula tab, copy and paste the following formula:
{3x ADX Cluster}

ShortADX:= vt_ADX(adxsh,adxsh);
MediumADX:= vt_ADX(adxmd,adxmd);
LongADX:= vt_ADX(adxlg,adxlg);

{ADX Reference Levels}

ADXbasicRLH:= 70;
ADXbasicRLL:= 30;
ADXcriticalRLH:= 90;
ADXcriticalRLL:= 20;

{3x +DI Cluster}

ShortPlusDMI:= vt_DMI(dmish).PlusDI;
MediumPlusDMI:= vt_DMI(dmimd).PlusDI;
LongPlusDMI:= vt_DMI(dmilg).PlusDI;

{3x -DI Cluster}

ShortMinusDMI:= vt_DMI(dmish).MinusDI;
MediumMinusDMI:= vt_DMI(dmimd).MinusDI;
LongMinusDMI:= vt_DMI(dmilg).MinusDI;

{+/-DMI Reference Levels}

PlusDMIbasicRLH:= 50;
PlusDMIbasicRLL:= 10;
PlusDMIcriticalRL:= 5;

MinusDMIbasicRLH:= 50;
MinusDMIbasicRLL:= 10;
MinusDMIcriticalRL:= 5;
- Click the “Save” icon to finish building the trading system.
To attach the trading system to a chart, select the “Add Trading System” option from the chart’s contextual menu, select “TASC - 11/2012 - TAC-DMI” from the trading systems list, and click the [Add] button.
A sample chart is shown in Figure 13.
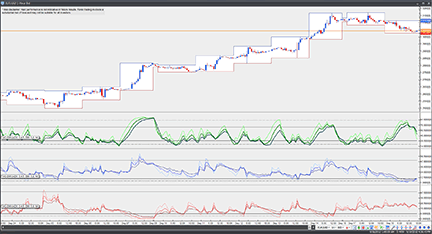
FIGURE 13: VT TRADER. Here is the TAC-DMI on a EUR/USD one-hour candlestick chart.
To learn more about VT Trader, visit www.vtsystems.com.
Risk disclaimer: Past performance is not indicative of future results. Forex trading involves a substantial risk of loss and may not be suitable for all investors.
—Chris Skidmore
Visual Trading Systems, LLC
vttrader@vtsystems.com, www.vtsystems.com
BACK TO LIST

TRADE NAVIGATOR: NOVEMBER 2012 TRADERS’ TIPS CODE
Trade Navigator offers everything needed to recreate the charts shown in “Identify The Start Of A Trend With DMI” by BC Low in this issue.
Here we will show you how to create a Template for the chart in Trade Navigator.
Creating the Chart
Go to the Add to Chart window by clicking on the chart and typing A on the keyboard.
ADX Pane:
Click on the Indicators tab, find the ADX indicator in the list and either double click on it or highlight the name and click the Add button.
Repeat this step two more times so that you have 3 copies of the ADX on the chart. Then click on the title of one of the lower ADX indicators and drag it into the same pane as the top ADX. repeat this step for the remaining ADX so that all three ADX indicators are in the same pane.
Click on the title of one of the ADX indicators and it will bring up the Chart Settings window with that ADX selected.
Change the Bars used in calculation value to 3 and the Show Initial Bars to False. Change the color for this indicator using the menu next to Color in the Appearance box on the Chart Settings window.
Click on the next ADX in that pane and change the values to 4 and True. Set a different color for this ADX to distinguish it from the other two.
Click on the final ADX and change the values to 5 and False. Click the OK button.
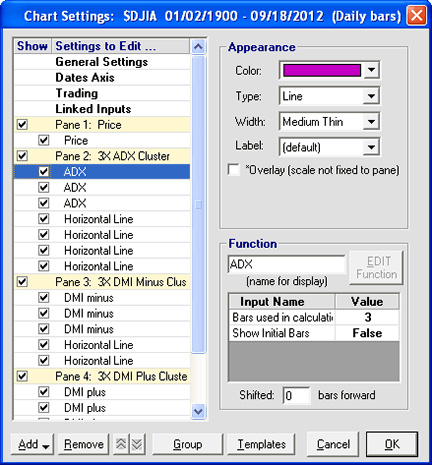
FIGURE 14: TRADE NAVIGATOR. Here are sample chart settings.
DMI minus Pane:
Click on the Indicators tab, find the DMI minus indicator in the list and either double click on it or highlight the name and click the Add button.
Repeat this step two more times so that you have 3 copies of the DMI minus on the chart. Click and drag the titles so that you have three copies of the DMI minus in one pane and then click one of the titles to edit.
Set the values to 5 and False for the first one and change the color. Set the second one to 8 and False and the third one to 14 and False. Remember to change the color so that all three have different colors. Click OK.
DMI plus Pane:
Click on the Indicators tab, find the DMI plus indicator in the list and either double click on it or highlight the name and click the Add button.
Repeat this step two more times so that you have 3 copies of the DMI plus on the chart. Click and drag the titles so that you have three copies of the DMI plus in one pane and then click one of the titles to edit.
Set the values to 5 and False for the first one and change the color. Set the second one to 8 and False and the third one to 14 and False. Remember to change the color so that all three have different colors.
When you have them the way you want to see them, click on the OK button.
You can add horizontal lines to the panes by placing the cursor where you want the line, holding down the Ctrl key on the keyboard and left clicking the mouse. Values for the horizontal lines can be edited in the Chart Settings window if desired.
You can save your new chart as a Template to use for other charts. Once you have the chart set up, go to the Charts dropdown menu, select Templates and then Manage chart templates. Click on the New button, type in a name for your new template and click OK.
Genesis Financial Technologies is providing this template, including the individual studies for each pane, in a special file named “SC201211,” downloadable through Trade Navigator.
—Michael Herman
Genesis Financial Technologies
www.TradeNavigator.com
BACK TO LIST
MICROSOFT EXCEL: NOVEMBER 2012 TRADERS’ TIPS CODE
In “Identify The Start Of A Trend With DMI” in this issue, author BC Low’s TAC approach gives us an interesting new way to use an old set of tools to look at trends over time.
The chart example provided here in Figure 15 approximates the chart in the article’s Figure 6. I added the +DI component for a more complete picture of the TAC possibilities.
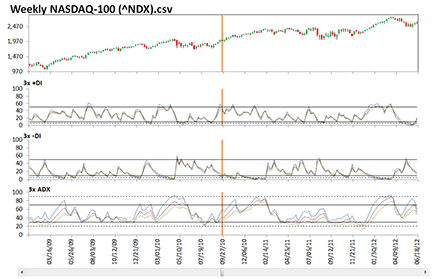
FIGURE 15: MICROSOFT EXCEL. Here is a sample Microsoft Excel implementation of the indicators discussed in BC Low’s article in this issue using a “scrollable cursor.”
The Excel creative effort is straightforward. The article’s sidebar on ADX provides the computational basics in an Excel format. I have adjusted the formulas from the sidebar to accommodate the way I sort my data — newest to oldest. I prefer this sequence for two reasons: first, it keeps the newest data visible close to the bottom of the charts; and second, online sources like Yahoo Finance export their historical data in this sequence. Thus, it’s minimal work to import fresh data.
Since much of the visual impact of the TAC indicators is the alignment of indicator convergence points with the price action, I provide a simple scrollable cursor (orange vertical bar) synchronized to the same date on each chart.
To download and use my spreadsheet, follow these steps:
- Right-click on the Excel file link; then,
- Select “save as” to place a copy of the spreadsheet file on your hard drive.
The spreadsheet file “IdentifyStartOfTrendWithDMI.xlsm” can be downloaded here.
—Ron McAllister
Excel and VBA programmer
rpmac_xltt@sprynet.com
BACK TO LIST
Originally published in the November 2012 issue of
Technical Analysis of Stocks & Commodities magazine.
All rights reserved. © Copyright 2012, Technical Analysis, Inc.
Return to
Contents


