This month's tips include formulas and programs for:
![]() TECHNIFILTER PLUS,
TECHNIFILTER PLUS,
![]() SMARTRADER,
SMARTRADER,
![]() TRADESTATION and
TRADESTATION and
![]() WAVE WI$E Market Spreadsheet
WAVE WI$E Market Spreadsheet
or return to Archive Index.
This month's tips include formulas and programs for:
TECHNIFILTER PLUS,
or return to Archive Index.
The set of TechniFilter Plus formulas called " OBV disparity trading system" produces a TechniFilter Plus strategy that implements the trading system presented in Phillip Holt's "Enhancing on-balance and negative volume" in this issue. In the article, Holt computes a ratio of two Bollinger %B calculations, one based on price and one based on a volume indicator (either the on-balance volume or the negative volume index). A %B calculation based on price expresses the position of the closing price within the upper and lower Bollinger bands. A value of "1" places the close at the top band, and a value of zero places the close at the bottom band. Values between zero and 1 place the close somewhere between the bands. If the close is outside the bands, the %B value will be less than zero (below the bottom band) or more than 1 (above the top band).
The basic %B calculation divides the close minus the bottom band by the distance between the bands. Since the upper band is two standard deviations of price above an average and the lower band is two standard deviations of price below this average, the distance between the two bands is just four standard deviations of the price. Formula 1 gives the %B price calculation. The "33" listed is the time parameter suggested by Holt. Formula 2 is the %B calculation based on OBV, represented by the building block K. (To test NVI instead of OBV, replace "K" with the NVI building block B in this formula, and change the parameters in formulas 4 and 5 to 0.95 and 1.1, respectively.) Formula 3 is Holt's on-balance volume disparity indicator (OBVDI). He suggests buying and selling when a four-unit average of this quantity breaks through specific levels. Formulas 4 and 5 express these buy-sell conditions, returning a "1" when the condition is true and a zero otherwise.
OBV Disparity Trading System
Strategy Name: VOLDSPTY

FORMULAS
1. name: %B_PRICE(33)                 format: ##.###
   formula: (C-CA&1+2*C|&1)/(4*C|&1)
2. name: %B_VOLIND(33)                format: ##.###
   formula: (K-KA&1+2*K|&1)/(4*K|&1)
3. name: DISPARITY                    format: ##.###
   formula: (1+[1])/(1+[2])
4. name: BUY(.85)                     format: ###
   formula: ([3]A4>&1) * (TY1=0)
5. name: SELL(.95)                    format: ###
   formula: ([3]A4<&1) * (TY1=0)

SIGNALS
1. BUY;   F4=1
2. SELL;  F5=1

RULES
1. Buy Long 1 at Today's Close on signal: S1
2. Sell Long 1 at Today's Close on signal: S2
In addition, the TechniFilter Plus formulas called "OBV disparity indicator" and "NVI disparity indicator" provide formulas for OBVDI and NVDI that you can use directly within your strategies and filter reports. They combine formulas 1, 2 and 3 into a single line:
OBV Disparity Indicator
Formula Name: OBVDI          Parameters: 33

Formula: ( 1 + (C-CA&1+2*C|&1)/(4*C|&1) ) / ( 1 + (K-KA&1+2*K|&1)/(4*K|&1) )

NVI Disparity Indicator
Formula Name: NVDI           Parameters: 33

Formula: ( 1 + (C-CA&1+2*C|&1)/(4*C|&1) ) / ( 1 + (B-BA&1+2*B|&1)/(4*B|&1) )
Registered owners of TechniFilter Plus can receive an E-mail copy of this strategy (and other TechniFilter Plus formulas, reports and strategies that have appeared in this column) by sending a request to rtrsoft@aol.com and noting the item(s) you want. You must include your TechniFilter Plus serial number in your request.
-- Clay Burch, RTR Software Inc.
Recreating Phillip Holt's on-balance volume disparity indicator (OBVDI) and negative volume disparity indicator (NVDI) in SmarTrader first depends on calculating Bollinger's %B based on price. Next, apply the same formulas to on-balance volume (OBV) and negative volume (NVI). A combination of preprogrammed studies, math functions and user formulas are used to create the new indicators in SmarTrader.
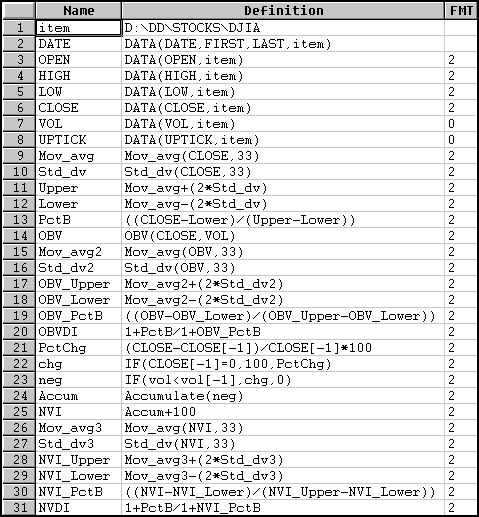
In the SpecSheet shown in Figure 1 below, rows 9 through 13 calculate the 33-period moving average and standard deviation, the upper and lower bands and, finally, %B based on price. This varies from a standard Bollinger band calculation, which typically uses 20 periods for the moving average and standard deviation. You may want to calculate a typical price using the formula (high+low+close)/3 for the price. Rows 15 through 19 calculate the same functions for OBV. Row 20 calculates the OBVDI. Rows 21 through 25 calculate the NVI. Rows 26 through 30 repeat the process of calculating %B, this time based on NVI. Row 31 then calculates the NVDI.
Figure 1: SmarTrader SpecSheet. The formulas listed here can be used to implement the OBV disparity indicator and NVI disparity indicator in SmarTrader.
CompuTrac Snap users may implement this system by substituting row 24, which uses the "accumulate" function, with a user row using the "ref" function as follows:
Accum Ref(0,0)+neg
We suggest plotting Bollinger bands over the bar chart, and in separate windows, plot the Bollinger bands over OBV and NVI. OBVDI and NVDI can be plotted as lines in separate windows.
-- Jim Ritter, Stratagem Software International
Phillip Holt's technique for testing the on-balance volume disparity indicator (OBVDI) and the negative volume disparity indicator (NVDI) against the NYSE Composite Index also seems to show promise for commodities. Looking at currencies, I found that with a little manipulation of the parameters and using a decent money management stop, the performance results were well above average. Following are both the OBVDI and the NVDI as user functions. A word of caution: Be sure to set the properties of the user functions to "series."
Name: OBVDI
Type: User-Function

Inputs: Length(Numeric);
Vars: BollTop(0), BollBot(0), PerB(0), OBVBollTop(0), OBVBollBot(0), OBVPerB(0);

BollTop=BollingerBand(Close,Length,2);
BollBot=BollingerBand(Close,Length,-2);
If (BollTop-BollBot)<>0 then PerB=(Close-BollBot)/(BollTop-BollBot);

OBVBollTop=BollingerBand(OBV,Length,2);
OBVBollBot=BollingerBand(OBV,Length,-2);
If (OBVBollTop-OBVBollBot)<>0 then OBVPerB=(OBV-OBVBollBot)/(OBVBollTop-OBVBollBot);
OBVDI=(1+PerB)/(1+OBVPerB);

Name: NVDI
Type: User-Function

Inputs: Length(Numeric);
Vars: BollTop(0), BollBot(0), PerB(0), NegVBollTop(0), NegVBollBot(0), NegVPerB(0), NegV(0);

If Currentbar=1 then NegV=100;
BollTop=BollingerBand(Close,Length,2);
BollBot=BollingerBand(Close,Length,-2);
If (BollTop-BollBot)<>0 then
    PerB=(Close-BollBot)/(BollTop-BollBot);
NegV=IFF(Volume<Volume[1],NegV+((Close-Close[1])/Close[1])*100,NegV);

NegVBollTop=BollingerBand(NegV,Length,2);
NegVBollBot=BollingerBand(NegV,Length,-2);
If (NegVBollTop-NegVBollBot)<>0 then
    NegVPerB=(NegV-NegVBollBot)/(NegVBollTop-NegVBollBot);

NVDI=(1+PerB)/(1+NegVPerB);
To duplicate the OBVDI used in Holt's article, use the Plot function to plot the indicator and then the average of that indicator:
Name: OBVDI w/ Avg
Type: Indicator

Plot1( OBVDI(33),"OBVDI");
Plot2( Average(OBVDI(33),4),"AvgOBVDI");
To plot the NVDI, substitute the NVDI function for the OBVDI in the above formula. Next, coding the system for the OBVDI is simple:
Name: OBVDI System
Type: System

Inputs: BLevel(.95), SLevel(.95);

IF Average(OBVDI(33),4) crosses over BLevel Then Buy on Close;
IF Average(OBVDI(33),4) crosses below SLevel Then Sell on Close;
All of this code will be made available on both the Omega Research area of America OnLine and at our Web site at http: //www.omegaresearch.com.
-- Miles Dunbar, Easy Language Specialist, Omega Research
The following Wave Wi$e formulas compute the OBVDI and NVDI presented in Phillip Holt's "Enhancing on-balance and negative volume":
A: Date      'Read in Date, Close and Volume
B: Close
C: Vol
D: Avg        @MAVG(CLOSE,33)
E: Upper      AVG+2*@STD(CLOSE,33)
F: Lower      AVG-2*@STD(CLOSE,33)
G: %B         (CLOSE-LOWER)/(UPPER-LOWER)
H: OBV        @INIT(1,VOL);
              @IF(CLOSE>CLOSE[-1],VOL+OBV[-1],
                 @IF(CLOSE<CLOSE[-1],OBV[-1]-VOL,OBV[-1]))
I: AvgObv     @MAVG(OBV,33)
J: UpObv      AVGOBV+2*@STD(OBV,33)
K: LoObv      AVGOBV-2*@STD(OBV,33)
L: %Bobv      (OBV-LOOBV)/(UPOBV-LOOBV)
M: ObvDI      (1+%B)/(1+%BOBV)
N: NegVol     @INIT(1,100);
              @IF(VOL<VOL[-1],NEGVOL[-1]+((CLOSE-CLOSE[-1])/CLOSE[-1])*100,NEGVOL[-1])
O: AvgNeg     @MAVG(NEGVOL,33)
P: UpNeg      AVGNEG+2*@STD(NEGVOL,33)
Q: LoNeg      AVGNEG-2*@STD(NEGVOL,33)
R: %BNeg      (NEGVOL-LONEG)/(UPNEG-LONEG)
S: NVDI       (1+%B)/(1+%BNEG)
-- Peter Di Girolamo, Jerome Technology
Return to Archive Index