August TRADERS' TIPS
Here is this month's selection of Traders' Tips, contributed by various developers of technical analysis software to help readers more easily implement some of the strategies presented in this issue.
You can copy these formulas and programs for easy use in your spreadsheet or analysis software. Simply "select" the desired text by highlighting it as you would in any word processing program, then use your standard key command for copy or choose "copy" from the browser menu. The copied text can then be "pasted" into any open spreadsheet or other software by selecting an insertion point and executing a paste command. By toggling back and forth between an application window and the open Web page, data can be transferred with ease.
This month's tips include formulas and programs for:
 TECHNIFILTER PLUS
METASTOCK
WAVEWI$E MARKET SPREADSHEET
TRADESTATION
SMARTRADER FOR WINDOWS
Return to August 1996 Contents or Back Issue Archive.
 TECHNIFILTER PLUS
In "Historical volatility and pattern recognition," Laurence Connors and Linda Bradford Raschke combine a historical volatility ratio with some short-term patterns to spot potential price moves. Here's a set of TechniFilter Plus formulas that will filter for these situations.
Formula 1 is the historical price volatility ratio. It compares the five-day standard deviation of the logarithm of the one-day price change ratio to the 99-day version of the same calculation. Connors and Raschke suggest using six-day and 100-day periods, but TechniFilter Plus uses five and 99 in its standard deviation calculation to reproduce the same values (since 100 days yield 99 one-day changes). Formula 2 is 1 if today is an inside day and zero otherwise. Formula 3 is 1 if today is an NR4 day (narrow range 4 pattern) and zero otherwise. Formula 4 is 1 if the volatility ratio is less than 0.5 and today is either an inside day or an NR4 day. Thus, a 1 in column 4 marks the days when a market move is expected according to this strategy.
report ID: H_VLTY        report title: VOLATILIT   compress: N
# of columns: 4     use name or ticker?: T   units to read: 110
1. title: VLTY_RAT                format: #####.##
   formula: (C/CY1)U9|5 / (C/CY1)U9|99
2. title: INSIDE DAY              format: ###
   formula: (H<HY1) & (L>LY1)
3. title: NR4                     format: ###
   formula: (H-L) < (H-L)Y1N3
4. title: SIGNAL                  format: ###
   formula: ([1]<.5) & ([2] ^ [3])
Next is a TechniFilter Plus strategy that implements Dennis Meyers's A/D volume, new-high, new-low market system that was featured in the July 1996 STOCKS & COMMODITIES. The formulas in this strategy rely heavily on TechniFilter Plus's ability to import stored time series data for direct use within calculations. The symbols for the imported time series are enclosed within tilde expressions, ~< and >~, as seen in formulas 1, 4, 6 and 7.
Formula 1 computes Vratio by loading two time series: ADV for advancing volume and DECV for declining volume. Formula 2 computes XVratio, the exponential average of the result from formula 1. Formula 3 computes volume strength, Vstr, using the maximum and minimum values of the calculation from formula 2. Formula 4 computes the Dow Jones average strength, DJstr. (Notice formula 4 is similar to formula 3 with ~<DJIA>~ replacing [2].) Formula 5 is the volume relative strength, Vrs. Formulas 6 and 7 are exponential averages of the new highs and new lows. Formulas 8 and 9 compute strength calculations based on the averages from formulas 6 and 7; they are similar to formulas 3 and 4. The signals use Meyers's trading rules.
Strategy Name: MARKET FORMULAS
1. name: VRATIO              format: ####.##
   formula: (~<ADV>~-~<DECV>~)/(~<ADV>~+~<DECV>~)
2. name: XVRATIO(10)         format: ####.##
   formula: [1]X&1
3. name: VSTR(10)            format: ####.##
   formula: 100*([2]-TN&1)/([2]M&1-[2]N&1) - 50
4. name: DJSTR(10)           format: ####.##
   formula: 100*(~<DJIA>~-TN&1)/(~<DJIA>~M&1-~<DJIA>~N&1) - 50
5. name: VRS                 format: ####.##
   formula: [3]-[4]
6. name: XNH(3)              format: ####.##
   formula: ~<NH>~X&1
7. name: XNL(3)              format: ####.##
   formula: ~<NL>~X&1
8. name: NLSTR(40)           format: ####.##
   formula: 100*([7]-TN&1)/([7]M&1-[7]N&1) - 50
9. name: NHSTR(10)           format: ####.##
   formula: 100*([6]-TN&1)/([6]M&1-[6]N&1) - 50
SIGNALS
1. BUY;F5>=5 AND F8<=-20 AND F9>=-10
2. SELL;F5<=-35 AND F8>=30 AND F9<=20
RULES
1. Reverse Short to Long 1 at Today's Close on signal: S1
2. Reverse Long to Short 1 at Today's Close on signal: S2
Registered owners of TechniFilter Plus can receive an E-mail copy of these strategies or other TechniFilter Plus formulas, reports and strategies that have appeared in this column by sending a request to rtrsoft@aol.com and noting the item(s) you want. You must include your TechniFilter Plus serial number with your request.
-Clay Burch, RTR Software
GO BACK
METASTOCK
You can use The Explorer in MetaStock to search for securities generating signals based on Connors and Raschke's historical volatility system. To do this, go to The Explorer and choose the New button. Enter the following column and filter formulas: (Ed. Note: this is the and replaces formula incorrectly entered in August 1996 issue.)
Col A: Vol rati    Std(Log(C/Ref(C,-1)),5)/
                   Std(Log(C/Ref(C,-1)),99)
Col B: NR4 day     HIGH - LOW < Ref(LLV(H-L,3),-1)
Col C: Inside      HIGH < Ref(HIGH,-1) AND LOW > Ref(LOW,-1)
Col D: High        HIGH
Col E: Low         LOW
Filter             colA < .5 AND (colB = 1 OR colC = 1)
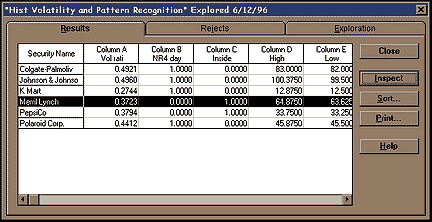 FIGURE 1: METASTOCK EXPLORER. Here, the OEX stocks are generating signals as of the close on June 11, 1996.
Run the exploration on the desired securities and display the report. In the example in Figure 1, the report shows the OEX stocks generating signals as of the close on June 11, 1996. Column A shows the ratio between the six-day and 100-day volatility. Column B displays a 1 if today is an NR4 day and a zero on all other days. Similarly, column C displays a 1 if today is an inside day. The high and low are displayed in columns D and E to determine the entry points.
-Allan McNichol, Equis International
GO BACK
WAVEWI$E MARKET SPREADSHEET
The following WaveWi$e spreadsheet formulas implement the historical volatility system presented by Connors and Raschke.
A: DATE 'Read in price data
B: HIGH
C: LOW
D: CLOSE
E: OPEN
F: VOL
G: HistVol    @LOG(CLOSE/CLOSE[-1]); @STD(G,5) /
              @STD(G,99)                           'Volatility ratio
H: LessPt5    @IF(HistVol <.5, 1)                  'Find volatility < .5
I: Inside     @IF(HIGH<HIGH[-1] & LOW > LOW[-1],1) 'Identify inside days
J: Range      HIGH-LOW                             'Compute todays range
K: NR4        @IF(RANGE<RANGE[-1] &
              RANGE<RANGE[-2] &
              RANGE<RANGE[-3],1)
L: Setup      @IF((LESSPT5=1 &
              INSIDE=1) | (LESSPT5=1 &
              NR4=1),1)
M: BuyStop    @IF(SETUP[-1]=1, HIGH[-1])           'Form the buy stop
N: SellStop   @IF(SETUP[-1]=1, LOW[-1])            'Form the sell stop
O: Buys       @SIGNAL(CLOSE,BUY,CLOSE>BUYSTOP,LOW<
              @SIGHIGH()-1)
P:
Q: PrLong     @PROFIT(O,P,LONG)                    'Profit of long trades
R: Sells      @SIGNAL(CLOSE,BUY,CLOSE<SELLSTOP,HIGH>
              @SIGLOW()+1)
S:
T: PrShort    @PROFIT(R,S,SHORT)                   'Profit of short trades
Using the true historical volatility formula (row G) on the Dow Jones Industrial Average from March 29, 1988, to February 23, 1996, yielded 119 trades with a gross profit of 589 points.
Substituting the following volatility measure (which uses only standard deviation):
G: HistVol CLOSE; STD(G,5) / @STD(G,99)
yielded 532 trades with a profit of 973 points.
-Peter Di Girolamo, Jerome Technology
GO BACK
TRADESTATION
Some of the best systems I've come across look for a setup pattern and then base the trading signals on the ensuing reaction. Laurence Connors and Linda Raschke's use of historical volatility in conjunction with bar patterns effectively identifies excellent setups. The Easy Language formula for historical volatility, which was given in STOCKS & COMMODITIES' November 1995 Traders' Tips, is rewritten here as a function. This TradeStation system will only enter long or short, so be sure to apply your own money management techniques. As one suggestion, the "Historical volatility and pattern recognition" article mentions using a trailing stop to lock in profits.
Function: HisVol
INPUTS: LOOKBCK(NumericSimple), ANNUAL(NumericSimple);
Vars: HVol(0), Per(0);
If DataCompression<=2 then Per=1;
If DataCompression=3 then Per=7;

HVol=StdDev(LOG(Close/Close[1]),LOOKBCK)*SquareRoot(ANNUAL/Per);
HisVol= HVol*100;
This function will automatically adjust to daily or weekly bars and also allows you to input the number of days in the annual period. This is helpful in that it gives you the option of using 365 calendar days or 250 trading days as the annual period.
System: His.Vol w/ Patterns
Vars: HVRatio(0), NR4(False), InBar(False);
HVRatio=(HisVol(6,365)/HisVol(100,365))*100;
NR4=Range=Lowest(Range,4);
InBar=H<H[1] and L>L[1];
If HVRatio <= 50 and (NR4 or InBar) then begin
     Buy at High + (1*MinMove points) stop;
     Sell at Low - (1*MinMove points) stop;
end;
By using the chart scanner, you can apply this system to a database of symbols to determine which generated orders. When executing the system, be sure to set the maxbarsback value to 101 and remember to apply the trailing stop as well.
-Miles Dunbar, Omega Research
GO BACK
SMARTRADER FOR WINDOWS
SMARTrader for Windows uses the alarm function to search a list of data items for simple or complex conditions defined by the user. To screen for the conditions described in "Historical volatility and pattern recognition," we need to calculate the short- and long-term volatility. This is done in rows 9 through 12 using the preprogrammed functions for log and standard deviation (Figure 2). Row 13 calculates the historical volatility. We multiplied by 100 for readability.
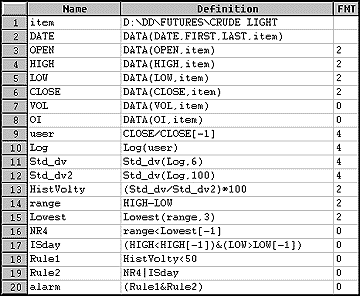 FIGURE 2: SMARTRADER. Here are the conditions to use in the formula builder.
To establish the narrow range 4 pattern (NR4), we first compute the daily range. Then, the Lowest function establishes the smallest range in three days. NR4 is a Boolean condition that is true only when the current day range is less than the lowest value of the previous three days.
The inside day, ISday, is a conditional stating that today's high is less than yesterday's high and today's low is greater than yesterday's low.
Rule 1 is true when historical volatility is less than 50%. Rule 2 is true when either NR4 or ISday are true. Finally, the Alarm is defined as true when rule 1 and rule 2 are true. This same system will work for users of CompuTrac SNAP.
-Jim Ritter, Stratagem Software International
GO BACK
Return to August 1996 Contents or Back Issue Archive.


