September TRADERS' TIPS

Here is this month's selection of Traders' Tips, contributed by various developers of technical analysis software to help readers more easily implement some of the strategies presented in this issue.

You can copy these formulas and programs for easy use in your spreadsheet or analysis software. Simply "select" the desired text by highlighting as you would in any word processing program, then use your standard key command for copy or choose "copy" from the browser menu. The copied text can then be "pasted" into any open spreadsheet or other software by selecting an insertion point and executing a paste command. By toggling back and forth between an application window and the open Web page, data can be transferred with ease.

This month's tips include formulas and programs for:

METASTOCK
TECHNIFILTER PLUS
WAVEWI$E MARKET SPREADSHEET
SMARTRADER
TRADESTATION

Return to Back Issue Archive or September Table of Contents

METASTOCK

Here are the MetaStock formulas for calculating the indicators used in my article, "Standard error bands":


21 period regression slope
(((Sum(Cum(1)*C,21))-(Sum(Cum(1),21)*Sum(C,21)/21))/
    ((Sum(Power(Cum(1),2),21))-(Power(Sum(Cum(1),21),2)/21)))

21 period %A
((C-Fml("21 period lower band (smoothed)"))/(Fml("21 period
    upper band (smoothed)")-Fml("21 period lower band
    (smoothed)")))

21 period R2 (smoothed)
Mov((Pwr(Corr(Cum(1),C,21,0),2)),3,S)

21 period upper band (smoothed)
Mov((21 * Sum(Cum(1) * C,21) - Sum(Cum(1),21) * Sum(C,21)) / 
    (21 * Sum(Pwr(Cum(1),2),21) - Pwr(Sum(Cum(1),21),2)) * 
    Cum(1) + (Mov(C,21,S) - Mov(Cum(1),21,S) * (21 * 
    Sum(Cum(1) * C,21) - Sum(Cum(1),21) * Sum(C,21)) / (21 * 
    Sum(Pwr(Cum(1),2),21) - Pwr(Sum(Cum(1),21),2))) + 
    2*(Sqrt(((Sum(Power(C,2),21)-(Power(Sum(C,21),2)/21)) -
    ((Sum(Cum(1)*C,21))-((Sum(Cum(1),21)*Sum(C,21)/21)))/
    ((Sum(Power(Cum(1),2),21))-(Power(Sum(Cum(1),21),2)/
    21))*((Sum(Cum(1)*C,21))-((Sum(Cum(1),21)*Sum(C,21)/
    21)))) /19)),3,S)

21 period regression (smoothed)
Mov((21*Sum(Cum(1)*C,21)-Sum(Cum(1),21)*Sum(C,21))/ 
    (21*Sum(Pwr(Cum(1),2),21)-Pwr(Sum(Cum(1),21),2))*Cum(1) 
    +(Mov(C,21,S)-Mov(Cum(1),21,S)*(21*Sum(Cum(1)*C,21) - 
    Sum(Cum(1),21)*Sum(C,21))/(21*Sum(Pwr(Cum(1),2),21)-
    Pwr(Sum(Cum(1),21),2))),3,S)

21 period lower band (smoothed)
Mov((21 * Sum(Cum(1) * C,21) - Sum(Cum(1),21) * Sum(C,21)) / 
    (21 * Sum(Pwr(Cum(1),2),21) - Pwr(Sum(Cum(1),21),2)) * 
    Cum(1) + (Mov(C,21,S) - Mov(Cum(1),21,S) * (21 * 
    Sum(Cum(1) * C,21) - Sum(Cum(1),21) * Sum(C,21)) / (21 * 
    Sum(Pwr(Cum(1),2),21) - Pwr(Sum(Cum(1),21),2))) - 
    2*(Sqrt(((Sum(Power(C,2),21)-(Power(Sum(C,21),2)/21)) -
    ((Sum(Cum(1)*C,21))-((Sum(Cum(1),21)*Sum(C,21)/21)))/
    ((Sum(Power(Cum(1),2),21))-(Power(Sum(Cum(1),21),2)/
    21))*((Sum(Cum(1)*C,21))-((Sum(Cum(1),21)*Sum(C,21)/
    21)))) /19)),3,S)

Binary bandwidth indicator
If((ATR(55)/(BBandTop(C,21,S,2)-
    BBandBot(C,21,S,2)))>.50,+1,0)
-- Jon Andersen, Equis International
GO BACK

TECHNIFILTER PLUS

Here are the TechniFilter Plus formulas for the indicators used in "Standard error bands" in this issue. You can use these formulas to display the bands on bar charts.

The first formula, STD_ERR, is the standard error calculation. The parameter 21 is the period used in the regression analysis. The second parameter, 19, is the first parameter minus 2. The second formula, LSF_PSE, is the top band, which is the least-squares-fit (Lsf) line plus 2 multiplied by the standard error. The third parameter is the number of standard errors added to the LSF line. The last formula, LSF_MSE, is the bottom band, which is the least-squares-fit line plus 2 multiplied by the standard error.


Library formulas for standard error bands 
Formula Name: STD_ERR   Parameters: 21,19 

Formula: (((C-CR&1)*T)F&1/&2)_.5 

Formula Name: LSF_PSE   Parameters: 21,19,2 

Formula: ( CR&1 + &3 * (((C-CR&1)*T)F&1/&2)_.5 )A3 

Formula Name: LSF_MSE   Parameters: 21,19,2 

Formula: ( CR&1 - &3 * (((C-CR&1)*T)F&1/&2)_.5 )A3
The next formula set uses the same calculations to define a filter report that can be used to screen for issues. Formula 1 in this report compares the 55-day average true range to the distance between the 21-day Bollinger bands. If the true range is more than 50% of the band difference, this formula returns a 1; otherwise, it's zero. Andersen uses this 50% requirement as his initial screen. The report also has columns showing the standard error value; the top and bottom bands; the %A calculation; the slope and value of the LSF line; and the r-squared calculation. The formulas reflect the three-day smoothing suggested by Andersen.


TechniFilter Plus report for screening standard error bands.
report ID: REGRESS report title: REGRESSION compress: N 
# of columns: 6   use name or ticker?: T   units to read: 30 

1. title: ATR:4SD                 format: ### 
   formula: ( ((H%CY1)-(L#CY1))X55 * 100 / (4*C|21) ) > 50 
2. title: STD_ERR                 format: #####.## 
   formula: (((C-CR21)*T)F21/19)_.5 
3. title: TOP_BAND                format: #####.## 
   formula: ( CR21 + 2*[1] )A3 
4. title: BOT_BAND                format: #####.## 
   formula: ( CR21 - 2*[1] )A3 
5. title: %A                      format: #####.## 
   formula: (C-[3]) * 100 / (4*[1]) 
6. title: REGRESS_SLOPE           format: #####.## 
   formula: CD21 
7. title: REGRESS_VALUE           format: #####.## 
   formula: CR21A3 
8. title: RSQUARE                 format: #####.## 
   formula: ((21*(C*CF0)F21-(CF21*CF0F21))*T/((21*(C*C)F21-
            (CF21*T))*(21*(CF0*CF0)F21-(CF0F21*T))))A3
Registered owners of TechniFilter Plus can receive an E-mail copy of these formulas or other TechniFilter Plus tips that have appeared in this column by sending a request to rtrsoft@aol.com and noting the item(s) you want. You must include your TechniFilter Plus serial number with your request.
-- Clay Burch, Rtr Software
GO BACK


WAVEWI$E MARKET SPREADSHEET

Here are the WaveWi$e spreadsheet formulas for implementing the indicators presented in the article "Standard error bands":


A: DATE                                  'Read in price data
B: HIGH
C: LOW
D: CLOSE
E: OPEN 
F: VOL  
G: Trend     @LREG(CLOSE,21,0)           'Regression
H: StdErr    @LREG(CLOSE,21,9)           'Standard error
I: SmoRegr   @MAVG(Trend,3)              'Smooth regression
J: SmoStEr   @MAVG(StdErr,3)             'Smooth std error
K: HiBand    SmoRegr+2*SmoStEr           'Upper band
L: LoBand    SmoRegr-2*SmoStEr           'Lower band
M: %A        100*(CLOSE-LoBand)/(HiBand-LoBand)
N: RSQ       @LREG(CLOSE,21,2)           'R-squared
O: SmoRSQ    @MAVG(RSQ,3)                'Smooth R-squared
P: Slope     @LREG(CLOSE,21,1)           'Regression slope
Q: Avg21     @MAVG(CLOSE,21)
R: BolBHi    AVG21+2*@STD(CLOSE,21)      'Bollinger high band
S: BolBLo    AVG21-2*@STD(CLOSE,21)      'Bollinger low band
T: TrueR     @TR(HIGH,LOW,CLOSE,1)       'True range
U: AvgTR     @MAVG(TrueR, 55)            'Average of true range
V: AlertR    AvgTR/(BolBHi - BolBLo)     'The alert ratio
W: AlertLv   @IF(AlertR >= 0.50, 1, 0)   'Alert ratio level hit
The use of linear regression and standard error are sound statistical measures. The standard error acts as a standard deviation above and below the regression line. However, the use of moving average smoothing in the above calculations distorts this method's statistical accuracy.
-- Peter Di Girolamo, Jerome Technology
GO BACK

SMARTRADER

For readers who would like to look beyond charts and graphs, here is a mechanism for analyzing the percentage of up days in the stock market by day of the week. The Dow Jones Industrial Average (DJIA) was used to test for up and down weekdays in the market. The data series extends from early 1989 to July 12, 1996.
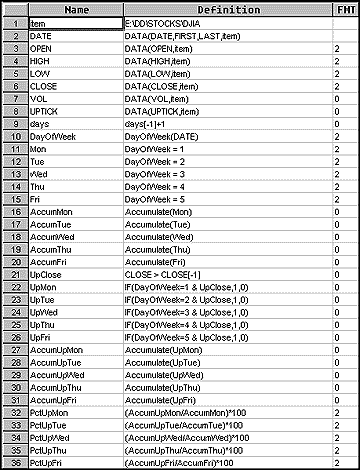
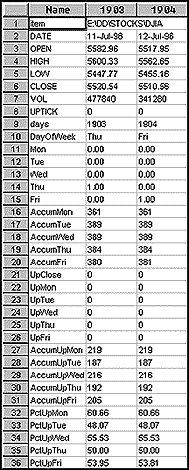
SMARTRADER SPECSHEET. The first spreadsheet shows the SmarTrader formulas for analyzing the percentage of up days in the stock market by day of week. The second spreadsheet shows an analysis of the Dow Jones Industrial Average based on the formulas given on the first.

Don't let the length of the SmarTrader specsheet alarm you. It's basically the same formulas repeated five times for each day of the week. Row 10 uses the DayOfWeek function. It displays the day of the week in the spreadsheet and can be tested for numeric values of 1 = Monday through 5 = Friday. Rows 11-15 are user rows that return a 1 if true and zero if false. Rows 16-20 use the Accumulate function to count how many of each weekday occurred in the data series.

Row 21 is a user row that returns a 1 if a day closed up and a zero otherwise. Rows 22-26 return a 1 if the day closed up and a zero otherwise according to the day of the week. Rows 27-31 count the total up closes by day of week.

Finally, rows 32-36 calculate the percentage of up days by day of week. In this test, the day of the week with the greatest percentage of up days was Monday, with 60.66%. The day of the week with the lowest percentage of up closes was Tuesday, with 48.07%.

-- Jim Ritter, Stratagem Software International
GO BACK

TRADESTATION

Due to scheduling difficulties, no Traders' Tips are presented this month for TradeStation or SuperCharts. Omega Research will return with programming tips for Easy Language next month.

GO BACK


Return to Back Issue Archive