NEW TECHNIQUES
Standard Error Bands
by Jon Andersen
Here's a new technique for placing trading bands around the price action of your favorite market. This technique shows how to recognize low-volatility situations and aid in forecasting trend direction.
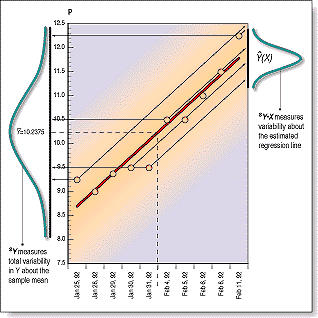
 FIGURE 1: VARIATION. The left bell curve represents two standard deviations
about the mean of 10 data points. The right bell curve shows two standard errors
of the estimated regression line (the solid line plotted through the data).
Note that the variation is higher with the standard error.
"The construction of standard error bands is similar to that of Bollinger bands. The difference? Instead of measuring the variance or degree of volatility around the average price using the standard deviation, standard error bands require the use of the standard error of the estimate around a 21-period linear regression line (Figure 1). The middle band is calculated as the ending value of a 21-period linear regression line and adding two standard errors to the ending value of the regression line to form the upper standard error band. To form the lower standard error band, subtract two standard errors from the end value of the linear regression line."
Excerpted from an article originally published in the September 1996 issue of Technical Analysis of STOCKS & COMMODITIES magazine.
© Copyright 1996, Technical Analysis, Inc. All rights reserved.
Return to Table of Contents


