November TRADERS' TIPS
Here is this month's selection of Traders' Tips, contributed by various developers of technical analysis software to help readers more easily implement some of the strategies presented in this issue.
You can copy these formulas and programs for easy use in your spreadsheet or analysis software. Simply "select" the desired text by highlighting as you would in any word processing program, then use your standard key command for copy or choose "copy" from the browser menu. The copied text can then be "pasted" into any open spreadsheet or other software by selecting an insertion point and executing a paste command. By toggling back and forth between an application window and the open Web page, data can be transferred with ease.
This month's tips include formulas and programs for:
 METASTOCK for Windows
 TRADESTATION
 TECHNIFILTER PLUS
 SMARTRADER
 WAVEWI$E MARKET SPREADSHEET
Return to Back Issue Archive or November Contents
 METASTOCK for Windows
To recreate the Pathfinder currency trading system (described in the October 1996 interview with Nelson Freeburg) in MetaStock for Windows, open two charts, one of the desired currency and the other of Treasury bonds. For this example, I used the Swiss franc. Choose Tile from the Window menu so both charts are visible. Drag the T-bonds price bar and drop it on the heading of the currency chart. Your currency chart should now have T-bonds plotted in the top inner window of the chart. Click on the T-bonds plot in the currency chart so it's selected (that is, little squares appear on the price bars). You will need to select the T-bonds plot each time before running a system test. The selected plot tells the MetaStock System Tester what to use for "P." Next, choose System Tester from the Tools menu, and then New to create a new system. Enter the following system rules, stops and options and then run the test.
System Name: The Pathfinder Trading System

Enter long:
Mov(C,6,S) > Ref(Mov(C,6,S),-1) AND
Mov(P,3,S) > Mov(P,25,S) AND
Alert(Cross(Mov(C,9,S),Mov(C,18,S)),10)

Close long:
Cross(Mov(C,18,S),Mov(C,9,S))

Enter short:
Mov(C,6,S) < Ref(Mov(C,6,S),-1) AND
Mov(P,3,S) < Mov(P,25,S) AND
Alert(Cross(Mov(C,18,S),Mov(C,9,S)),10)

Close short:
Cross(Mov(C,9,S),Mov(C,18,S))

Maximum loss stop
Long and short positions.
Maximum loss of 0.016 Points.

Initial equity    Points Only
Positions         Long and short
Trade price       Open
Trade delay       1
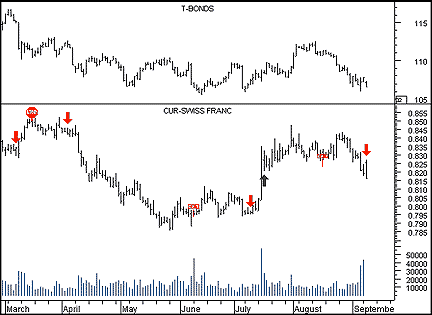
 Figure 1: METASTOCK. Here's a sample chart of the Pathfinder currency trading system for T-bonds and the Swiss franc produced from MetaStock.
After running the test, your chart should look similar to the one in Figure 1. Note that the maximum stop-loss amount should be changed to 0.032 for the British pound and 0.02 for the Australian and Canadian dollars when testing these contracts.
--Allan J. McNichol, Equis International
800 882-3040, 801 265-8886
Internet: https://www.equis.com
GO BACK
 TRADESTATION
To create the r- squared indicator described in "Standard error bands" by Jon Andersen in the September 1996 STOCKS & COMMODITIES, you must first create the coeffR function. This function must be saved and verified before you can create the r- squared indicator. The coeffR function is used to calculate the correlation coefficient r.
Type:  User Function
Name:  coeffR

Inputs: Length(Numeric);
Vars: X(0), UpEQ(0), LowEQ1(0), LowEQ2(0), LowEQT(0);

X = BarNumber;
UpEQ = Summation(X * Close, Length) -
  (Length * Average(X, Length) * Average(Close, Length));
LowEQ1 = Summation(Square(X), Length) -
  (Length * Square(Average(X, Length)));
LowEQ2 = Summation(Square(Close), Length) -
  (Length *Square(Average(Close, Length)));
LowEQT = SquareRoot(LowEQ1 * LowEQ2);

IF LowEQT <> 0 Then
  CoeffR = UpEQ / LowEQT;
Once you have created and verified the coeffR function, you can then create the r- squared indicator using the following code in the Power Editor.
Type: Indicator
Name: R - Squared

Inputs: Length(21), AvgLen(3);
Vars: R(0), SquareR(0), AvgSqrR(0);

R = coeffR(Length);
SquareR = Square(R);
AvgSqrR = Average(SquareR, AvgLen);

Plot1(AvgSqrR, "AvgSqrR");
Plot2(1, "Upper");
Plot3(0, "Lower");
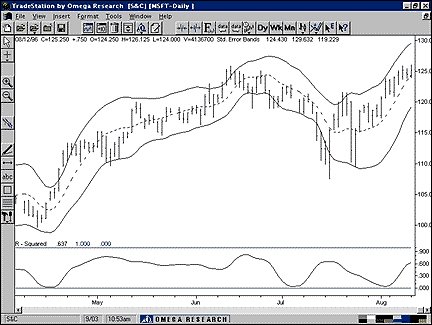
 Figure 2: TRADESTATION. The r-squared indicator with standard error bands as recreated in TradeStation is shown here.
A sample chart of the r- squared indicator appears in Figure 2. This code is available at both the Omega Research Forum on America Online as well as at Omega's Web site.
-- Gaston Sanchez, Omega Research
800 422-8587, 305 270-1095
Internet: https://www/omegaresearch.com
GO BACK
 TECHNIFILTER PLUS
Here's a TechniFilter Plus trading strategy that implements the Pathfinder trading system. Formula 1 is the basis for the alert. It compares the nine-day average of the close to the 18-day average of the close. Formula 2 checks to see if the six-day average is rising. That's the first condition. Formula 4 refers to the TBOND issue from formula 3. Formula 4 checks for the second condition. Signal 1 is used in rule 1 to open a long position. Signal 3 is used in rule 2 to close long positions. Rule 3 stops a long position if there's a $2,000 drop in the position equity. Signal 2 is used in rule 4 to open a short position. Signal 4 is used in rule 5 to close short positions. Rule 6 stops a short position if there is a $2,000 drop in the equity.
Strategy Name: PATHFIND
FORMULAS
1. name: ALERT             format: ###
   formula: CA9 > CA18
2. name: COND_1            format: ###
   formula: CA6 > TY1
3. name: TBOND             format: ####.##
   formula: ~<TBOND>~
4. name: COND_2            format: ###
   formula: [3]A3 > [3]A25
SIGNALS
1. BUY;F1=1 & F2=1 & F4=1
2. SELL;F1=0 & F2=0 & F4=0
3. CLOSE_LONG;F1=0
4. CLOSE_SHORT;F1=1
RULES
1. Buy Long 1 at Tomorrow's Open on signal: S1
2. Sell Long 1 at Tomorrow's Open on signal: S3
3. Stop Long 1 at C on signal: EQ < -2000
4. Open Short 1 at Tomorrow's Open on signal: S2
5. Cover Short 1 at Tomorrow's Open on signal: S4
6. Stop Short 1 at C on signal: EQ < -2000
Registered owners of TechniFilter Plus can receive an E-mail copy of these strategies or other TechniFilter Plus formulas, reports and strategies that have appeared in this column by sending a request to rtrsoft@aol.com and noting the item(s) you want. You must include your TechniFilter Plus serial number with your request.
-- Clay Burch, RTR Software
919 510-0608
E-mail: rtrsoft@aol.com
GO BACK
 SMARTRADER
The Pathfinder currency trading system described in the October 1996 interview with Nelson Freeburg consists of three simple moving averages (of six, nine and 18 days) based on the currency's closing price and two simple moving averages (of three and 25 days) based on the closing price of the Treasury bond.
Three conditions must be met to enter a long position. They are defined as follows:

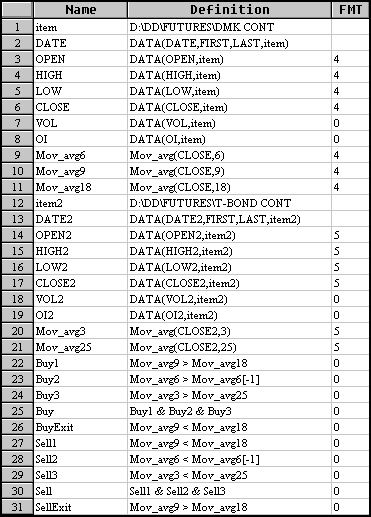
Figure 3: SMARTRADER. The rules for the Pathfinder currency trading system are given in this SmarTrader spreadsheet.
Buy1: The nine-day moving average of the currency must be greater than the 18-day moving average.
Buy2: Today's six-day moving average of the currency must be greater than yesterday's six-day moving average.
Buy3: The three-day moving average of the Treasury bond must be greater than the 25-day moving average of the bond.
A buy signal occurs when Buy1, Buy2 and Buy3 are all "true." BuyExit signals an exit from the long position when the nine-day moving average of the currency is less than the 18-day moving average of the currency. Although it's not shown in the spreadsheet in Figure 3 for brevity's sake, a protective stop is placed when defining the trade rows.
The sell rules for the short position are exactly the opposite of the buy rules.
--Jim Ritter, Stratagem Software International
504 885-7353
E-mail: Stratagem1@aol.com
GO BACK
 WAVEWI$E MARKET SPREADSHEET
Here are the WAVEWI$E spreadsheet formulas for implementing the Pathfinder currency trading system.
A: DATE    @OMEGA(d:\omega\data\future,DM0695,Deutsche
           Mark 06/95,DB)
B: HIGH
C: LOW
D: CLOSE
E: OPEN
F: DATE    @OMEGA(d:\omega\data\future,TR0695,Treasury
           Bonds 06/95,DB)
G: HIGH
H: LOW
I: CLOSE
J: OPEN
K:         @MATCH(A,F,F,J)     'MATCH THE DATES OF BOTH
                                FILES
L: high2
M: low2
N: close2
O: open2
P: avg6    @MAVG(D,6)
Q: avg9    @MAVG(D,9)
R: avg18   @MAVG(D,18)
S: avg3    @MAVG(N,3)
T: avg25   @MAVG(N,25)
U: proc1   @PROCEDURE(BUYLOGIC)
V:
W: trades  @TRADE(U,V,LONG)
X: profit  @PROFIT(U,V,LONG)
Y: equity  @EQUITY(U,V,LONG)
Z:

'PATHFINDER BUY LOGIC
'#NAME POSITION    AZ$1
#NAME ENTRY        AZ$2
#NAME STOPAMT      2000       'SET STOP AS DESIRED
'
@CELLPUT(@COLUMN()+1,@ROW(),@BLANK())
@IF @ROW()= 1 THEN      'INITIIALIZE SYSTEM
  POSITION=0 'SHOW WE ARE FLAT
@RETURN(@BLANK())
ENDIF
@IF POSITION = 0 THEN 'WE ARE NOW FLAT
  @IF (AVG9[-1] < AVG18[-1]) &
  (AVG9 > AVG18) THEN 'CHECK FOR BUY ALERT
  @IF AVG6 > AVG6[-1] THEN 'SECOND CONDITION
  @IF AVG3 > AVG25 THEN 'THIRD CONDITION POSITION=1
'READY TO BUY
ENDIF
ENDIF
ENDIF
  @RETURN(@BLANK())
ENDIF
@IF POSITION = 1 THEN 'WE ARE READY TO BUY
        POSITION=2 'POSITION ESTABLISHED
        ENTRY=OPEN
        @RETURN(ENTRY)
ENDIF
@IF POSITION = 2 THEN 'WE ARE LONG
        @IF LOW-ENTRY < -STOPAMT | 'USE LOW OR CLOSE
        (AVG9[-1] > AVG18[-1] &
        (AVG9 < AVG18)) THEN
        POSITION=3 'NEED TO CLOSE
  ENDIF
@IF @ROW() =@ENDROW() THEN 'CHECK FOR END OF DATA
@CELLPUT(@COLUMN()+1,@ROW(),OPEN)
ENDIF
@RETURN(CLOSE)
ENDIF
@IF POSITION = 3 |
@ROW() = @ENDROW() THEN 'READY TO CLOSE
        POSITION=0 'GO FLAT
@CELLPUT(@COLUMN()+1,@ROW(),OPEN)
@RETURN(OPEN)
ENDIF
@RETURN(@BLANK())
-- Peter Di Girolamo, Jerome Technology
908 369-7503
E-mail: jtiware@aol.com
GO BACK
Return to Back Issue Archive or November Contents


![]() METASTOCK for Windows
METASTOCK for Windows ![]() TRADESTATION
TRADESTATION ![]() TECHNIFILTER PLUS
TECHNIFILTER PLUS ![]() SMARTRADER
SMARTRADER ![]() WAVEWI$E MARKET SPREADSHEET
WAVEWI$E MARKET SPREADSHEET


