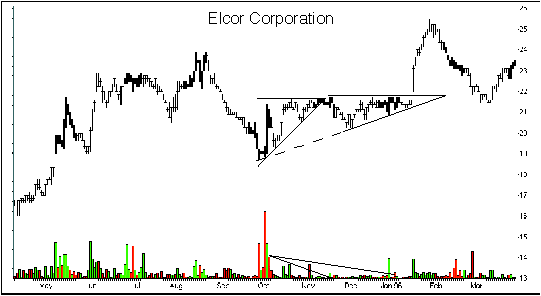
Last issue, symmetrical triangles and the ways to trade with this particular chart formation were the topic at hand. This month, we present two more variations of the triangle, the ascending and descending triangles, their attributes and how to use them in your investment decisions.
"I get excited when I find one of these triangles being formed in a stock I own. My experience has taught me that ascending triangles, unlike symmetrical triangles, will indicate which way prices will move on the breakout: Up! Unfortunately, these soldiers are rare. In the more than 150 stocks I follow daily, literally, only a handful of ascending triangles have appeared in the past year and a half. Descending triangles are much more common."

"Figure 1 shows two ascending triangles in Elcor Corp. (ELK). Prices entered the first formation at the beginning of October and quickly topped out at 21-5/8. Each time the stock hit this level, it retreated for another try. Unfortunately, the price flailed between 21-5/8 and higher lows until they squeezed out the triangle apex without breaking out on the upside. Even though the price moved up on November 16 to close at the day's high of 21-3/4 on volume of 18,800 shares -- more than 10 times the 1,700 shares of the previous day -- it was too late in the formation to be a powerful move."