This cycles software specialist discusses an indicator based on cyclical analysis."A cycle is one market characteristic that can be scientifically measured. Although they can be measured, they are still maddening because they are in essence ephemeral; they come and they go. Our recent research, however, indicates there is a fundamental cycle parameter that leads us to the correct trading strategy for any current market mode."
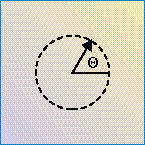
FIGURE 1: PHASE. Consider a cycle to be one trip around a circle, or a 360-degree movement. Phase describes the location within a cycle in degrees. "One easy way to picture a cycle is as an indicator arrow bolted to a rotating shaft, as can be seen in the phasor diagram of Figure 1. Each time the arrowhead sweeps through one complete rotation, a cycle is completed. The phase increases uniformly throughout the cycle, as shown in Figure 2. The phase continues for the next cycle but is usually drawn as reset to zero to start the next cycle."
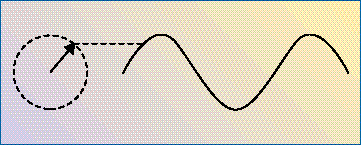
FIGURE 2: ADDING TIME. A sinewave in the time domain can be generated by placing a pen on the arrowhead and drawing the paper along at a uniform rate, just like a seismograph.
The parameter we use is the phase of the cycle. The measured phase tells us with great sensitivity when we are in the trend mode, enabling the capture of a large fraction of the trend movement.
For more information on the calculations used in this article, click on the sidebars "Basic code for phase calculation" and "TradeStation code for phase calculation."