This private trader, who was profiled in The New Market Wizards, discusses one of his techniques to trade the market based on an early signal for trend direction."Over the years I have studied many unique trading methods, and I have developed my own personal approach to trading the markets. I discussed some of my analytical and trading methods in the September 1995 STOCKS & COMMODITIES interview. Here's a follow-up, introducing how I combine two methods: the first I call multiple time frames, and the second I refer to as the Fibonacci Trader method."
FIBONACCI TRADER
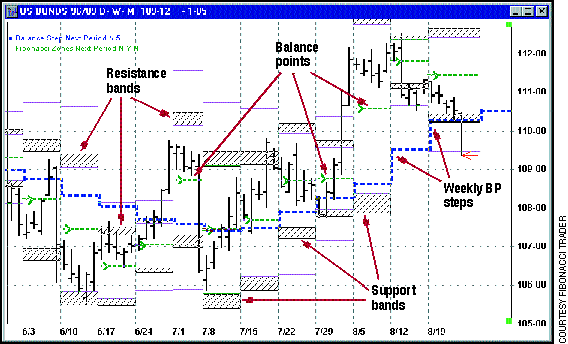
The first calculation is the fixed balance point. The weekly fixed balance point is simply the weekly high, low and close, summed and divided by three. This weekly balance point is plotted as a fixed horizontal line into the next week's column - that is, the week to come, plotted across the five daily bar dates, from Monday through Friday.
"A quick glance at the chart (Figure 2) shows you how the weekly balance point steps can indicate the trend of the daily bars. Note the direction of the balance point steps. When daily prices are above the steps, you can look to buy at support, but if the daily bars are above the weekly balance point steps and the weekly balance point steps have also turned up, you have stronger evidence that the buy signals are now really more important in the direction of the tradable trend."
An approach based on multiple time frames uses analysis of a higher time frame, such as the weekly bar chart, to define the tradable trend and important support and resistance bands for the daily bar chart.