December 1996 TRADERS' TIPS
Here is this month's selection of Traders' Tips, contributed by various developers of technical analysis software to help readers more easily implement some of the strategies presented in this issue.
You can copy these formulas and programs for easy use in your spreadsheet or analysis software. Simply "select" the desired text by highlighting as you would in any word processing program, then use your standard key command for copy or choose "copy" from the browser menu. The copied text can then be "pasted" into any open spreadsheet or other software by selecting an insertion point and executing a paste command. By toggling back and forth between an application window and the open Web page, data can be transferred with ease.
This month's tips include formulas and programs for:
 METASTOCK for Windows
 TRADESTATION
 SMARTRADER
 TECHNIFILTER PLUS
 WAVEWI$E MARKET SPREADSHEET
or return to Table of Contents
 METASTOCK for Windows
To recreate in MetaStock the 2/20-day EMA breakout system as described by David Landry in this issue, begin by choosing System Tester from the Tools menu. Next, choose New and enter the following system test rules and options:
Enter long
Alert(Cross(Sum(L > Mov(C,20,E),2) = 2,.5),10) AND
HIGH >= Peak(1,Cross(Sum(L > Mov(C,20,E),2) = 2,.5) *
HHV(H,2),1) + .001{10 ticks} AND
BarsSince(Cross(Sum(L > Mov(C,20,E),2) = 2,.5)) <
BarsSince(LOW <= Mov(C,20,E))
Close long
LOW <= Mov(C,20,E)
Enter short
Alert(Cross(Sum(H < Mov(C,20,E),2) = 2,.5),10) AND
LOW <= Peak(1,Cross(Sum(H < Mov(C,20,E),2) = 2,.5) *
LLV(L,2),1) - .001{10 ticks} AND
BarsSince(Cross(Sum(H < Mov(C,20,E),2) = 2,.5)) <
BarsSince(HIGH >= Mov(C,20,E))
Close short
HIGH >= Mov(C,20,E)
Initial equity     Points Only
Positions          Long and short
Trade price        Close
Trade delay        0

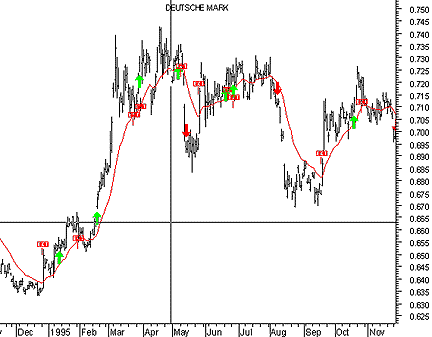
Figure 1: METASTOCK. Here's a sample chart of the 2/20-day EMA breakout system in MetaStock.
Note the {10 ticks} comment in the system rules. The value used in these rules will work for most currencies. However, you should change this value based on the commodity that you're testing.
A sample chart of the 2/20-day EMA breakout system in MetaStock is shown in Figure 1.
--Allan J. McNichol, EQUIS International
800 882-3040, 801 265-8886
Internet: https://www.equis.com
GO BACK
 TRADESTATION
The 2/20-day Ema breakout technique is represented below as both an indicator and a system. The indicator will plot the 20-day exponential moving average as well as paint the breakout bar. The system signals entry/exit points based on the ones specified by David Landry.
Type:  Indicator
Name:  Mov Avg X 2_20
Inputs: Price(Close), AvgLen(20);
Vars: AvgVal(0);
AvgVal = XAverage(Price, AvgLen);
Plot1(AvgVal, "EMA");

{Entry Alert Criteria}
IF (Lowest(Low, 2) > AvgVal AND Low 1 Bar Ago Crosses Above
  AvgVal 1 Bar Ago) OR (Highest(High, 2) < AvgVal AND
  High 1 Bar Ago Crosses Below AvgVal 1 Bar Ago) Then Begin
     IF CheckAlert Then Alert = True;
        Plot2(High, "Alert");
        Plot3(Low, "Alert");
End;
Please note this indicator requires specific style settings. The Type for Plot1 (EMA) should be "Line." The Type for Plot2 (Alert) should be "BarHigh." The Type for Plot3 (Alert) should be "BarLow." Plot2 and Plot3 will be of the same color.
The Power Editor system code for the 2/20-day EMA breakout system offers an additional input called StpPnts. This input allows you to easily set the points above the high for the buy stop, or the points below the low for the sell stop.
Type: System
Name: Mov Avg X 2_20
Inputs: Price(Close), AvgLen(20), StpPnts(10);
Vars: AvgVal(0), Buyit(0), Sellit(0);
AvgVal = XAverage(Price, AvgLen);

{Buy/Sell Entry Setup}
IF Lowest(Low, 2) > AvgVal AND Low 1 Bar Ago Crosses Above AvgVal AND
   MarketPosition <> 1 Then Begin
      Buyit = Highest(High, 2) + StpPnts Points;
      Condition1 = True;
End;
IF Highest(High, 2) < AvgVal AND High 1 Bar Ago Crosses Below AvgVal
AND
   MarketPosition <> -1 Then Begin
      Sellit = Lowest(Low, 2) - StpPnts Points;
      Condition2 = True;
End;

{Buy/Sell Entry Orders}
IF Lowest(Low, 2) > AvgVal AND Condition1 Then
      Buy Next Bar at Buyit Stop;
IF Highest(High, 2) < AvgVal AND Condition2 Then
      Sell Next Bar at Sellit Stop;

{Long/Short Exits}
ExitLong Next Bar at AvgVal Stop;
ExitShort Next Bar at AvgVal Stop;

IF MarketPosition <> 0 Then Begin
      Condition1 = False;
      Condition2 = False;
End;
This code is available at Omega's Web site. The file name is 2_20EMA.ELA.
-- Gaston Sanchez, Omega Research
800 422-8587, 305 270-1095
Internet: https://www/omegaresearch.com
GO BACK
 SMARTRADER
The 2/20-day EMA breakout system is basically a trend-following system. It is implemented in David Landry's article by defining a 20-day exponential moving average (EMA) and establishing trade entry/exit rules.
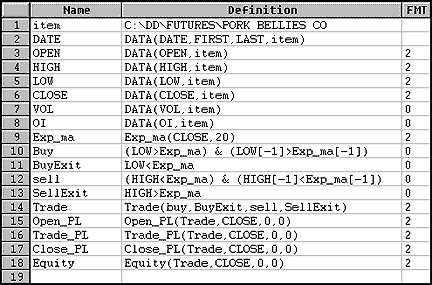
The buy rule simply defines the condition that today's low be greater than the EMA and that yesterday's low also be greater than yesterday's EMA. We didn't attempt to incorporate the 10-tick price stop but instead took signals just from the buy alert condition. A BuyExit occurs on the penetration of the EMA by the low. The sell rule is the opposite of the buy rule using the high price below the EMA. SellExit occurs on the penetration of the high through the EMA.
Since this is a trend-following system, we suggest incorporating J. Welles Wilder's directional movement indicator (DMI) to help avoid the whipsaws that are common with moving average systems when they're caught in a trading range.
The SmarTrader system rules are given in Figure 2.

Figure 2: SMARTRADER. The rules for implementing the 2/20-day EMA breakout system in SmarTrader are shown here.
--Jim Ritter, Stratagem Software International
504 885-7353
E-mail: Stratagem1@aol.com
GO BACK
 TECHNIFILTER PLUS
Here's a TechniFilter Plus trading strategy that implements David Landry's 2/20-day EMA breakout system. Formula 1 gives the entry price for a long position. This price is the larger of the high prices on the first two days that the lows are above the 20-day exponential moving average. This price is valid as long as the lows stay above the average. Formulas 2 and 3 are used jointly to decide whether the price is valid. Formula 2 gives the number of days since the low price last broke above the average. Formula 3 asks whether the low has stayed above the average for this variable period of time. If the price is valid, it's 1, and zero otherwise.
Formulas 4, 5 and 6 give the analogous information on the sell side. Formula 4 is the entry price for a short position. Formula 5 is the number of days since the down cross of the high price and the average. Formula 6 indicates whether the high has stayed below the average since the cross.
Rule 1 instructs to open a long position at the buy alert price if today's high breaks above the buy alert price and the buy is valid (low prices have remained above the average since the cross). Rule 2 exits a long position at the average price if the low drops below the average. Rule 3 instructs to open a short position at the sell alert price if today's low breaks below the sell alert price and the sell is valid (high prices have remained below the average since the cross). Rule 4 exits a short position at the average price if the high rises above the average.
2/20-Day EMA Breakout System
Strategy Name: 2-20EMA
FORMULAS
1. name: BUYSTOP                format: #####.##
   formula: ((H%HY1)*((L-CX20)Y1U2-TY1=1))U31
2. name: TIMEBUYALERT           format: ####
   formula: ((L-CX20)Y1U2-TY1=1)U51
3. name: BUYVALID               format: ####
   formula: (L>CX20)N[2]
4. name: SELLSTOP               format: #####.##
   formula: ((L#LY1)*((H-CX20)Y1U2-TY1=-1))U31
5. name: TIMESELLALERT          format: ####
   formula: ((H-CX20)Y1U2-TY1=-1)U51
6. name: SELLVALID              format: ####
   formula: (H<CX20)N[5]
7. name: EXITPRICE              format: #####.##
   formula: CX20
8. name: HIGH                   format: ####.##
   formula: H
9. name: LOW                    format: ####.##
   formula: L
SIGNALS
1. BUY LONG;F8 > F1 AND F3=1
2. SELL LONG;F9 < F7
3. OPEN SHORT;F9 < F4 AND F6=1
4. CLOSE SHORT;F8 > F7
RULES
1. Buy Long 1 at F1* on signal: S1
2. Sell Long 1 at F7* on signal: S2
3. Open Short 1 at F4* on signal: S3
4. Cover Short 1 at F7* on signal: S4
This TechniFilter Plus strategy and those of previous months can be downloaded from RTR's Web site.
-- Clay Burch, RTR Software
919 510-0608, E-mail: rtrsoft@aol.com
Internet: https://www.rtrsoftware.com
GO BACK
 WAVEWI$E MARKET SPREADSHEET
Here are the WAVEWI$E spreadsheet formulas for implementing the 2/20-day EMA breakout system.
A: DATE     @TC2000(c:\tc2000\data,SP-500,STANDARD & POORS 500,DB,010193)
B: HIGH
C: LOW
D: CLOSE
E: OPEN
F: VOL
G: Ema20    @EAVG1(CLOSE,20)          'Compute EMA
H: Simple   @SIGNAL(CLOSE,BUY,CLOSE>EMA20,CLOSE<=EMA20)
I:
J: Prof1    @PROFIT(H,I,LONG)         'Profit of a simple EMA buy system
K: Color1   @IF(Simple>0,GREEN,WHITE) 'Set Dynamic Color Bar
L: SigEMA   PROCEDURE(EMABUY)
M:
N: ProfEma  @PROFIT(L,M,LONG)         'Profit of 2/20 EMA Buy system
O: Color2   @IF(SIGEMA>0,GREEN,WHITE) 'Set Dynamic Color Bar

' EMA BREAKOUT 2/20 DAY BUY RULES
#NAME STATE  X$1
#NAME BSTOP  X$2
#NAME TICK   .0625                    'SET TICK UNIT
@IF(@ROW() = 1 THEN                   'INITIALIZE
  STATE=0                             'SET STATE TO FLAT
  @FOR X$3=1 TO @ENDROW()             'CLEAR ANY OLD VALUES
      @CELLPUT(@COLUMN()+1,X$3,@BLANK())
  NEXT
ENDIF
@IF STATE = 0 THEN                    'CHECK IF FLAT
  @IF LOW>EMA20 & LOW[-1]>EMA20[-1] THEN
      STATE=1                         'ALERT IN EFFECT
      BSTOP=@MAX(HIGH,2)+10*TICK      'SET THE BUY STOP
  ENDIF
  @RETURN(@BLANK())                   'NO POSITION
ENDIF
@IF STATE = 1 THEN                    'CHECK IF ON BUY ALERT
  @IF HIGH >= BSTOP THEN              'BUY STOP IS HIT
      STATE=2                         'BUY SIGNAL IN EFFECT
      @RETURN(CLOSE)                  'BUY ON CLOSE
  ENDIF
  @IF LOW <= EMA20 THEN               'CHECK FOR CANCEL ALERT
      STATE=0                         'CANCEL ALERT
        ENDIF
  @RETURN(@BLANK())                   'NO POSITION
ENDIF
@IF STATE = 2 THEN                    'CHECK IF ON BUY SIGNAL
  @IF LOW <= EMA20 THEN               'CHECK FOR SELL SIGNAL
      STATE=0                         'SHOW NOW FLAT
      @CELLPUT(@COLUMN()+1,@ROW(),CLOSE)
      @RETURN(CLOSE)                  'SELL ON CLOSE
  ENDIF
  @RETURN(CLOSE)                      'SHOW MARKED TO MARKET
ENDIF
@RETURN(0)                            'GIVE ERROR RETURN
-- Peter Di Girolamo, Jerome Technology
908 369-7503
E-mail: jtiware@aol.com
GO BACK
Return to Table of Contents
![]() METASTOCK for Windows
METASTOCK for Windows ![]() TRADESTATION
TRADESTATION ![]() SMARTRADER
SMARTRADER ![]() TECHNIFILTER PLUS
TECHNIFILTER PLUS ![]() WAVEWI$E MARKET SPREADSHEET
WAVEWI$E MARKET SPREADSHEET 
