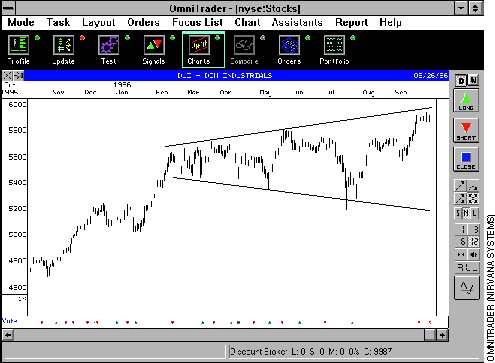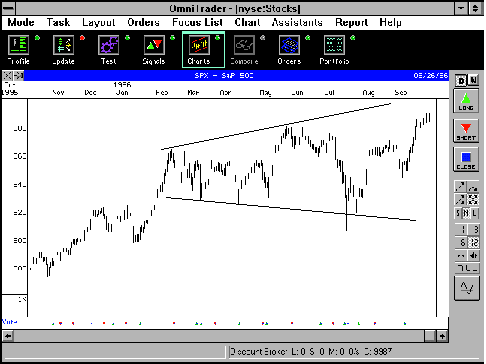
Classic chart analysis and Elliott wave theory both consider the expanding or broadening triangle chart pattern to be a reversal of a long-term trend, and further, that such an event may be occurring in the Dow Jones Industrial Average. Here are the details.
"As technicians ply their trade, they look at myriad manifestations of price and volume such as stochastics, head and shoulder patterns, and advance-decline lines to attempt to divine the market's direction. Most often the scene we see is a variation on an old theme, played out in new ways. Every now and then, however, something unusual occurs, and this is such a time for the stock market. The Dow Jones Industrial Average (Djia) (Figure 1), the Standard & Poor's 500 (Figure 2) and the New York Stock Exchange index (Figure 3) appear to be tracing a rare but powerful formation that will influence the ongoing discussion of bull versus bear markets - and, in my opinion, the formation is decidedly bearish. This rare pattern is the expanding triangle or broadening top (Figure 4)."


"The expanding triangle is one of a group of triangle formations. Most technicians consider the contracting triangle in its various forms, such as the symmetrical, ascending and descending triangles, useful for forecasting price action. Expanding triangles are rare, so much so that few technicians may even be aware of them. Nevertheless, an expanding triangle is even more reliable than the contracting triangle for forecasting future price trends."
The expanding triangle, which is also known as a broadening top, usually consists of three peaks, each higher than the previous peak, and two valleys, the second lower than the first.