Have you ever wondered how to improve the performance of your favorite indicator or trading system? By using your indicator to signal a buy and a beta-adjusted trailing stop to get you out, you could improve your investing results."During my quest for the perfect trading system, I noticed that the use of a trailing stop significantly improved performance of the system. The improvement did not apply to just one trading system; it applied across numerous indicators and strategies that I tested. In my testing, it became clear that the buy and sell signals should be treated independently. This is why you may want to have two indicators in your system: one to get you in and one to get you out. Here's a technique I developed called BATS, a beta-adjusted trailing stop, that uses the stock's beta to adjust the setting of a trailing stop-loss."
THE PROBLEM
Stop-loss points can be determined in numerous ways: support and resistance levels, dollar loss, percentage loss and so forth. There are also different types of protective stop-loss orders -- breakeven, trailing or progressive, profit objective, time and so forth. In doing research, I came across a method in Dun & Bradstreet's Guide to $Your Investments$ that sets a stop-loss price according to a stock's beta and further adjusts the stop to account for a stock price, the idea being that a stop set according to a stock's volatility allows daily price fluctuations to be ignored. You get stopped out when the trend changes against you and not because the stock had a large daily trading range.THE MAJOR AND MINOR TABLES
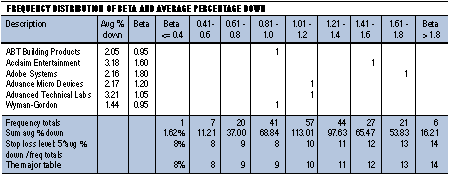
To create a table of stop-loss percentages, first I did a frequency distribution on my database of stocks according to beta. This is shown in Figure 1. Frequency distribution is a fancy name for simply counting the number of stocks within a given beta range. Beta is a measure of the volatility of a stock compared with an index or average. The Value Line Investment Survey, for example, compares a stock with the New York Stock Exchange Composite Index. A beta of 1.50 means that a stock tends to rise or fall 50% more than the NYSE Composite Index.

If you use your favorite indicator to time the purchase, then use the beta-adjusted trailing stop to tell you when to sell; your trades may be more profitable.