February TRADERS' TIPS
Here is this month's selection of Traders' Tips, contributed by various developers of technical analysis software to help readers more easily implement some of the strategies presented in this issue.
You can copy these formulas and programs for easy use in your spreadsheet or analysis software. Simply "select" the desired text by highlighting as you would in any word processing program, then use your standard key command for copy or choose "copy" from the browser menu. The copied text can then be "pasted" into any open spreadsheet or other software by selecting an insertion point and executing a paste command. By toggling back and forth between an application window and the open Web page, data can be transferred with ease.
This month's tips include formulas and programs for:
 METASTOCK
 TRADESTATION
 SMARTRADER
 TECHNIFILTER PLUS
 WAVEWI$E MARKET SPREADSHEET
or return to Back Issue Archive
 METASTOCK
In the August 1996 STOCKS & COMMODITIES, an article by Thom Hartle titled "The market facilitation index" showed how to color chart bars to identify chart patterns based on changes in the market facilitation index and volume. This issue, I wanted to demonstrate how to do this using MetaStock 6.0's new Expert Advisor.
The first step is to create a new expert by choosing Expert Advisor from MetaStock's Tool menu, and then choose New from the Expert Advisor. Name the expert "Market Facilitation Index," enter any notes you like and then click on the Highlights tab. Enter the following Highlights by choosing New, choosing the color and then entering the following formulas:
Green Bar (Green bar)
ROC((H-L)/V,1,$) > 0 AND
ROC(V,1,$) > 0

Fade Bar (Blue bar)
ROC((H-L)/V,1,$) < 0 AND
ROC(V,1,$) < 0

Fake Bar (Dk Gray bar)
ROC((H-L)/V,1,$) > 0 AND
ROC(V,1,$) < 0

Squat Bar (Red bar)
ROC((H-L)/V,1,$) < 0 AND
ROC(V,1,$) > 0
After you have entered the four Highlights, click OK to finish editing the expert's properties. You can now right-click on the heading or background of any chart. Next, select Expert Advisor and then Attach from the Chart shortcut menu. Attach the market facilitation index expert, and it will highlight the four market facilitation patterns that were discussed in Hartle's article. Note: You can save a chart as a template with this expert attached, and then any time you apply the template to a chart, the market facilitation index expert will automatically attach to the chart.
-- Allan J. McNichol, EQUIS International
800 882-3040, 801 265-8886
Internet: https://www.equis.com
GO BACK
 TRADESTATION
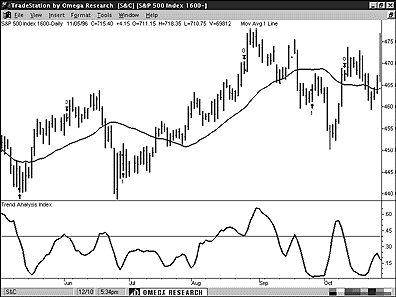
The June 1996 STOCKS & COMMODITIES contained an article by Adam White titled "The derivative moving average." The analysis techniques discussed in the article can be recreated using either the Power Editor or the Quick Editor in TradeStation. Below is the Quick Editor code for the analysis techniques discussed in the article. The first is the trend analysis index (TAI) user function, the TAI indicator and the derivative moving average system.
 FIGURE 1: TRADESTATION, S&P 500. This sample chart shows a 28-day moving average, the derivative moving average system and the trend analysis index.
The TAI function must be created first. Remember, we will be using the Quick Editor:
Type: User Function
Name: TAI

TAI = (Highest(Average(Price,AvgLen),TAILen)-
Lowest(Average(Price,AvgLen),TAILen))*100/Close
After entering the above code in the Quick Editor's Function Formula tab, click on the Inputs tab and type the following code under Name and Default Type:
  Price   Numeric
  AvgLen  Numeric
  TAILen  Numeric
Once you have successfully recreated the TAI function, you can then recreate the Tai indicator using the Quick Editor code below.
Type: Indicator
Name: Trend Analysis Index

Plot1   IFF(CurrentBar > AvgLen, TAI(Price, AvgLen, TAILen), 0)
After entering the above code in the Quick Editor's Indicator Formula tab, click on the Inputs tab and type the following code under Name and Default Value:
  Price   Close
  AvgLen  28
  TAILen  5
To recreate the derivative moving average system in TradeStation, you can use the Quick Editor code below. Remember that this system involves long positions only. Thus, the system only includes a long entry and long exit.
Type: System
Name: Derivative MA

Long Entry:

IF:     MarketPosition = 0 AND Average(Price, AvgLen)[1] =
Lowest(Average(Price, AvgLen),LowLen)[1]
then
Buy This Bar on Close

Long Exit:

IF:     MarketPosition = 1 AND TAI(Price, AvgLen, TAILen) Crosses
Below ExitLev
then
ExitLong This Bar on Close
After entering the above code in the Quick Editor's Indicator Formula tab, click on the Inputs tab and type the following code under Name and Default Value:
  Price    Close
  AvgLen   28
  LowLen   4
  TAILen   5
  ExitLev  .4
This code is available at Omega's Web site. The file name is "DMA_TAI.ELA."
-- Gaston Sanchez, Omega Research
800 422-8587, 305 270-1095
Internet: https://www/omegaresearch.com
GO BACK
 SMARTRADER
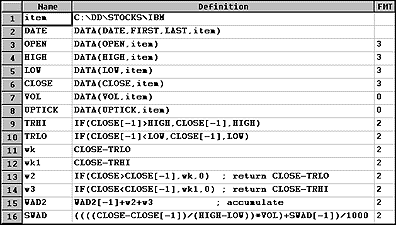
Larry Williams's on-balance volume for stocks (SWAD) and Williams's advance/decline of price (WAD2) techniques can be recreated using the User Formula Builder (Figure 2) in SMARTrader for Windows.
 FIGURE 2: SMARTrader. The User Formula Builder in SMARTrader can be used to implement Williams's on-balance volume for stocks (SWAD) and Williams's advance/decline of price (WAD2) techniques.
To develop SWAD, we first use if statements to establish the true high (TRHI), which is the greater of today's high or yesterday's close, and true low (TRLO), which is the lesser of today's low or yesterday's close. This is done in rows 9 and 10. Rows 11 and 12 compute the difference of the close and TRLO and the difference of the close and TRHI. The if statement in row 13 returns the value of the close minus TRLO on up days. The if statement in row 14 returns the value of the close minus TRHI on down days. Row 15 is a recursive formula that adds w2 plus w3 to the previous total for WAD2. Two if statements are used so that on the rare times when the close is unchanged from the prior day, zero is added to the accumulated total.
Row 16 is the formula for SWAD. Simply put, it is today's close minus yesterday's close divided by today's high minus today's low, with that quantity multiplied by Vol. The result is then added recursively to the previous SWAD. The final result is divided by 1,000 for readability.
These exact formulas can also be used in the SNAP module of CompuTrac/PC.
-- Jim Ritter, Stratagem Software International
504 885-7353
E-mail: Stratagem1@aol.com
GO BACK
 TECHNIFILTER PLUS
Here's a TechniFilter Plus trading strategy that implements Jeremy Konstenius' technique for timing entry and exit positions given in "Combining trend and oscillator signals," which appeared in the December 1996 STOCKS & COMMODITIES.
Formulas 1 and 2 are the close and simple moving average, respectively. Formula 3 is the slope of the five-week least-squares fit line computed using the closing prices. Formula 4 is the trigger line, which is the value of the 50-week least-squares fit line computed using the values from formula 3 (the slopes of the five-week line). You enter long when the close is above the moving average and the slope is above the trigger line. You exit long when either of these entry conditions turn false. You enter short when the close is below the moving average and the slope is below the trigger line (formula 4). You exit short when either of these conditions fail.
Strategy Name: TRND_OSC
FORMULAS
1. name: CLOSE         format: ####.##
   formula: C
2. name: AVERAGE       format: ####.##
   formula: CA30
3. name: LSF_SL        format: ####.##
   formula: CD5
4. name: LSF_VL_SL     format: ####.##
   formula: [3]R50
SIGNALS
1. ENTER_LONG; F1>F2 & F3>F4
2. EXIT_LONG; F1<F2 ^ F3<F4
3. ENTER_SHORT; F1<F2 & F3<F4
4. EXIT_SHORT; F1>F2 ^ F3>F4
RULES
1. Buy Long 1 at Tomorrow's Open on signal: S1
2. Sell Long 1 at Tomorrow's Open on signal: S2
3. Open Short 1 at Tomorrow's Open on signal: S3
4. Cover Short 1 at Tomorrow's Open on signal: S4
This TechniFilter Plus strategy and those of previous months can be downloaded from RTR's Web site.
-- Clay Burch, RTR Software
919 510-0608
E-mail: rtrsoft@aol.com
Internet: https://www.rtrsoftware.com
GO BACK
 WAVEWI$E MARKET SPREADSHEET
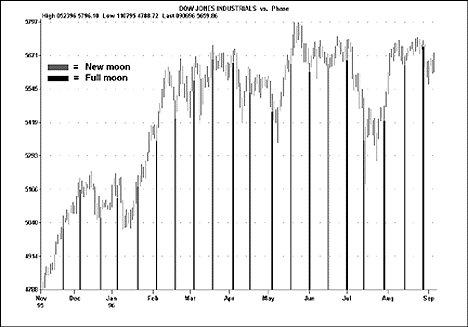
The following WAVEWI$E study displays lunar/solar eclipses and new/full moon cycles against the Dow Jones Industrial Average. Lunar eclipses/full moon bars are colored green, while solar eclipses/new moon bars are colored red.
moon.sdy - view moon cycles

A:   DATE       @TC2000(c:\tc2000\data,DJ-30,DOW JONES INDUSTRIALS,DB)
B:   HIGH
C:   LOW
D:   CLOSE
E:   OPEN
F:   VOL
G:
H:   Moon       @MOON(A,-5)              'Get lunar positions
I:   ECcolor    @IF(MOON >= 1.9, GREEN, @IF(MOON <=-1.9, RED))
J:   Eclipse    @IF(ECCOLOR > 0, LOW)    'Form eclipse bars
K:   MNcolor    @IF(MOON >= 0.9, GREEN, @IF(MOON <= -0.9, RED))
L:   Phase      @IF(MNCOLOR > 0, LOW)    'Form full/new moon bars
M:
Figure 3 displays new and full moon positions.
 FIGURE 3: WAVEWI$E. This sample WAVEWI$E output displays new and full moon positions against the Dow Jones Industrial Average.
-- Peter Di Girolamo, Jerome Technology
908 369-7503
E-mail: jtiware@aol.com
Internet: https://members.aol.com/jtiware
GO BACK
Return to Back Issue Archive


![]() METASTOCK
METASTOCK ![]() TRADESTATION
TRADESTATION ![]() SMARTRADER
SMARTRADER ![]() TECHNIFILTER PLUS
TECHNIFILTER PLUS ![]() WAVEWI$E MARKET SPREADSHEET
WAVEWI$E MARKET SPREADSHEET


