TRADING TECHNIQUES

The 10%
Swing Filter


by Mark Vakkur, M.D.

Price filters identify trends while eliminating noise below a certain percentage change. Here's a trading method using a 10% price filter for the S&P 500 stock index.
 

"Although trend-following systems work well during established trends, they can produce disastrous results at market turning points. For example, momentum investors obeying the dictum "Buy high and sell higher" could get crushed if they were fully leveraged at a major market top. Further, oscillators should theoretically help signal a change in trend, but often do so prematurely. A stochastic signals an overbought condition very early in a major rally. To participate in the bulk of major market swings while knowing when to tighten stops and reduce position size, a trader must have some means of estimating the odds of the market changing its trend."

THE 10% FILTER
"The 10% filter, also known as zigzag in some trading software packages, is based on the swing indicator developed by Art Merrill and John McGinley, which in turn was based on the swing filter used by the legendary stock trader Jesse Livermore. A filter attempts to eliminate insignificant price oscillations and highlight only the trend that a trader considers significant."

If the market is more than 75% extended since its last 10% correction, then expect a negative 12-month return (dividends ignored) and a 60% probability of a market decline.

EXTENDEDNESS
I began by collecting the monthly closes for the S&P 500 from 1950 to 1995. Then I applied a 10% filter and calculated the percentage the market exceeded or fell below the last low or high point of each swing. I treated this percentage value, which I call extendedness, as an indicator, computing it via the following formulas. (Although the filter is based on a simple concept, it requires several spreadsheet columns and formulas to quantify and integrate it into a system. There may be a more compact way of doing this, but creating a few extra columns can pay off in terms of readability and ease of modification.)
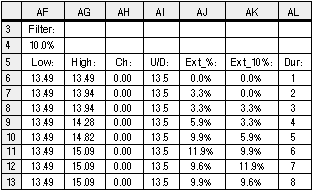
Figure 1: Here's a spreadsheet showing the 10% filter columns as explained.

First, I entered the monthly S&P 500 closing prices (intramonth highs and lows were ignored, but given the size of the filter, the results are hardly affected) into a spreadsheet. See Figure 1 for a printout of this spreadsheet (S&P 500 data, in column C, are not shown).
 

INTEREST RATES?
INFLATION? GROWTH?
"Of course, all things are never equal; extendedness says nothing about interest rates, inflation or growth prospects, or the overall health of the economy -- only that in the past, on average, when the market has been this high it has declined over the next year. To be a bull in an extended market requires making a strong case as to why it will be different this time."


Mark Vakkur is a psychiatrist and a stock trader. He can be reached at 1751 Vickers Circle, Decatur, GA 30030, or via E-mail at mvakkur@mem.po.com.
Excerpted from an article originally published in the February 1997 issue of Technical Analysis of STOCKS & COMMODITIES magazine. © Copyright 1997, Technical Analysis, Inc. All rights reserved.

Return to February Contents