This month, Meyers uses a daily indicator based on the Dow Jones Utility Average as a market timing system for the Standard & Poor's 500 index."In the August 1995 STOCKS & COMMODITIES, I presented a stock market timing system that I called the utility stock market indicator. This system uses the weekly relative strength of the Dow Jones Utility Average (DJUA) to the Standard & Poor's 500 index to derive a stock market system. The weekly model had a number of weaknesses that we will attempt to resolve. Before we start, remember: No model, no matter how simple or sophisticated, can be relied on to guarantee future profits. Positive performance based on hypothetical trading can in no way give any assurances that the system will produce profits. I must issue this warning because many readers simply take these systems without any study on their own and invest their assets blindly. There is nothing more dangerous."
"While weekly models are good for filtering out price fluctuation noise, they can leave the trader exposed to large adverse price movements or loss of opportunity during the trading days between the weekly buy and sell signals. In addition, weekly models have some weekly data distortions each year due to holidays. Holidays shorten a workweek of five days to four, and the amount of market activity is much less than a regular five-day week, leading to distortions in the indices."
SOME COMPUTATIONS
TradeStation computes total net profits based on the sum of the difference in prices of the buy and sell signals. To incorporate the price percentage returns, I will take the log to the base e of the S&P 500 index. This function is called "Ln" in mathematics and "LOG" in TradeStation. To avoid confusion, I will use the TradeStation function name, LOG, to represent Ln. The difference in the Log of the S&P between two dates approximates the percentage difference of the S&P between those two dates. If the S&P is 730 now and 740 on a later date, then the S&P is:
(740 -730)/730 = 0.0137 or 1.37%greater at the later date. On the other hand,
LOG(740) -LOG(730) = 0.0136and, as you can see, this approximates the percentage calculation. Using Excel, I will create an ASCII file that consists of the LOG of the S&P 500 closing prices. I will then use the Log file as the price series when deriving the optimized parameters.
A modification of the utility model derives from the fact that buy and sell signals are quite different. Thus, the lookback period in deriving buy signals should be independent of the lookback for deriving sells.

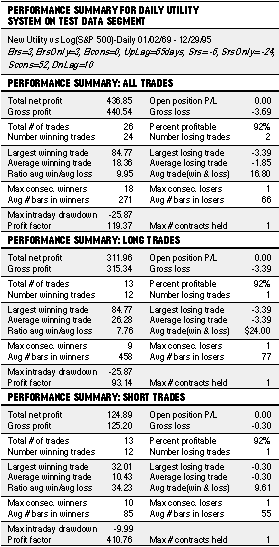
= = = Figure 1 presents the performance summary for the test data segment from January 1, 1969, to December 31, 1995, using the optimum parameter values chosen; Figure 2 presents the trade-by-trade summary. The performance is obviously excellent because the data was curve-fitted -- there were only two losses over the entire 28-year period. Clearly, this is an unrealistic expectation. All we have proved is that we have curve-fitted this fixed 28-year daily time segment of data very well with the model.
While the excellent performance of this curve-fit gives the illusion that the Holy Grail of stock market systems has been found, nothing could be further from the truth. Out-of-sample testing must be performed. If the performance results from the out-of-sample test are similar to the test segment, then the probability increases that the model has captured the price dynamics of the S&P 500 index.