Sometimes a trade doesn't work out the way you hoped it would, but you can always learn from your mistakes if you take the time to review your trades. Take a lesson from this failed trade.
After I began trading in the stock market in earnest, I started a notebook with commentary about all my trades. In it, I discuss the reasons for buying a stock and note them shortly after purchase. When I sell a stock, I note reasons for the success or failure of the trade. The notebook is divided into investment styles: Trend channel trade, triangles, 1-2-3 trend change, long-term holding, fundamental value and so forth. I can review my trades by investment style and recall the lessons I learned from each trade.Experience allows us to recognize a mistake when we make it again. Well, I want to minimize my mistakes, and so I use the notebook to help identify patterns before they become significant problems.
Usually,the scenario is fundamental in content. I watched a famous market participant lose large chunks of his fortune several times, betting heavily on the fundamentals he had thoroughly researched. Each time he knew he was right.
THE COMPANY
When I buy a stock, I don't just look at its chart pattern; I investigate the company and look at its fundamental structure as well. Great company fundamentals may not translate into a higher stock price for years, and that's where technical analysis comes into play. I use the fundamentals to build a firm understanding of the company and the technicals to time the purchase and sale.RG Barry is a member of the footwear industry, the world's largest manufacturer of comfort footwear. Primarily, it makes slippers mostly sold under the Dearfoams label nationwide and also has a growing international exposure.
During the 1990-91 recession, the company restructured its operations by consolidating manufacturing operations, cutting its payroll and relocating warehouses. In 1991, the stock hit its low of $1.60 per split-adjusted share. In 1993, the company pioneered the Thermal Comfort Products (Tcp) category. Tcp's first product was a microwave-activated heat cushion, designed primarily to be taken on outdoor excursions on cold days.

In July 1994, RG Barry bought its main competitor in the Tcp field, Vesture Corp. Since 1991, the company has expanded internationally while domestic sales increased steadily along with the share price. In late 1994, however, the company stumbled. Fourth-quarter 1994 was unseasonably warm in the US, and coupled with the weak retail market, sales of cold weather products plummetted. The stock price declined from a high of about $15 to $6 in a month (Figure 1).

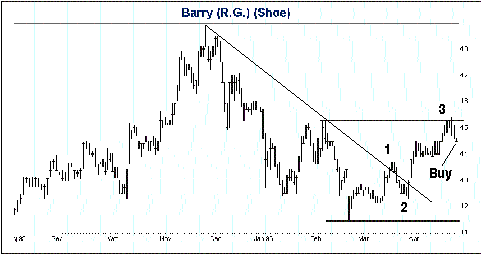
In Figure 2, you can see that the stock cooled during the traditionally weak first half. The decline, represented by the downsloping trendline, presented a buying opportunity. When I first started drawing trendlines, I drew them all over the place until I found out that there was a right and wrong way to draw them.