INDICATORS

The Moving Average
Convergence/Divergence
Histogram


by Mark Vakkur, M.D.

Here's a novel way of using the moving average convergence/divergence (MACD) histogram to generate buy and sell signals for stock and mutual fund traders. Not only that, included is a simple means of analyzing risk-adjusted trading system performance.


The moving average convergence/divergence indicator, developed by Gerald Appel, is constructed by taking the difference of two moving averages of the closing price -- one short, one long. This difference is smoothed with a moving average, and a comparison is made between the difference and its own moving average. For example, first subtract the 26-period moving average from a 12-period moving average to generate the indicator, which can be plotted as a line. A rising MACD line tells us that the momentum of the market is rising, since the "faster," shorter moving average is rising more quickly than the "slower," longer moving average.

Next, obtain a moving average of the MACD line, called a signal line; a popular choice is a nine-period moving average. The traditional interpretation of this indicator is to buy when a rising MACD line crosses above its signal line, and to sell when it crosses below it.

Ultimately, the MACD measures momentum. Its buy signals accompany strong uptrends, while its sell signals are given not when prices actually begin to decline but when the rate of their upward climb slows. This highlights two disadvantages to the indicator: First, its lag means you will miss the early part of any major move, since by the time it's identified the move will be well under way, and second, the sell signals tend to be early, forcing you to exit prematurely.

Here's a modification to this indicator to address these two problems. The idea was inspired by Alexander Elder's Trading for a Living.
 

THE MACD HISTOGRAM
The MACD histogram is constructed by subtracting the MACD line from the signal line. This can then be plotted as a histogram. In the following examples, I will use a nine-bar/12-bar/nine-bar combination, but traders are welcome to experiment with different parameters.
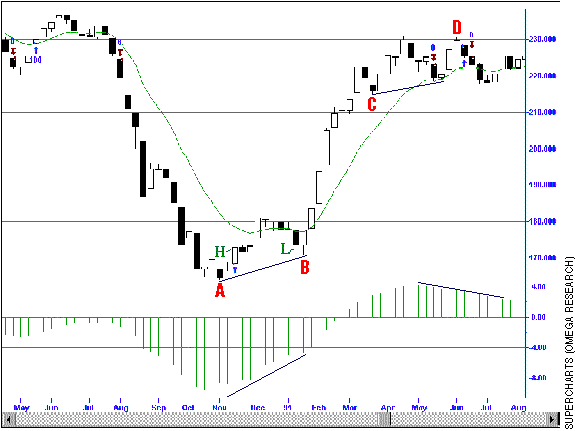
Figure 1: Value Line. The buy signal based on the MACD histogram of last week was higher than that of the histogram two weeks ago, and the price of the asset this week exceeds the weekly high of the past week (point A). The exit rule is when the histogram turns down, place a sell-stop at the bar's low for the next week (point B).

As an example, examine Figure 1, which shows a weekly candlestick chart of the Value Line Index in 1990-91. At point A, the MACD histogram is negative but rising, hinting that higher prices might lie ahead. Conversely, a high MACD histogram may not necessarily mean higher highs lie ahead if the trend in the MACD histogram is down (for example, after point D). As Elder points out, a market or asset forming higher highs in price not confirmed by higher highs in the Macd histogram may be particularly vulnerable to a correction.

Keep in mind the risks of overoptimization, however; finding a particular set of parameters that worked outstandingly in the past does not guarantee good future results.


INDIVIDUAL STOCKS
The MACD histogram works well with individual stocks as well as indices. As with any indicator or system, however, it should be backtested on historical data before being traded in real time and coordinated with other indicators. There are a number of stocks for which the MACD histogram, applied mechanically, is of limited use. I have found that large-capitalization, blue-chip stocks perform poorly with the MACD histogram, which is better applied to smaller-cap, more active stocks that are more likely to form strong, sustained trends.

To avoid the pitfalls of optimization, I chose which parameters of the MACD histogram to use (nine-week/12-week/nine-week) before testing the system on a stock. If the results were flat or negative, I did not consider the stock further. If the results were positive, I next looked at the breakdown of trades and the profit factor, or ratio of gross profits to gross losses. I discarded any stock the aggregate performance of which came from one or two outstanding trades, as well as any stock the profit factor of which was less than two. In real life, after slippage and commissions, trading such a system could lead to financial hemorrhage.


Mark Vakkur is a psychiatrist and a stock trader. He can be reached at 1751 Vickers Circle, Decatur, GA 30030, or via E-mail at mvakkur@mem.po.com
Excerpted from an article originally published in the April 1997 issue of Technical Analysis of STOCKS & COMMODITIES magazine. 
© Copyright 1997, Technical Analysis, Inc. All rights reserved.

Return to April Contents