R ising and falling wedges share common traits with the triangle family. In previous articles, I discussed three forms of triangles -- symmetrical, ascending and descending triangles. Recall that symmetrical triangles have bounding lines -- one slopes upward, while the other slopes downward. In ascending triangles, the top boundary region is described by a flat line, while the other boundary region slopes up to meet it. Descending triangles have a flat region as their base while the top slopes downward. Lines connecting the boundary regions intersect at the triangle apex and have generally diminishing volume over time.
Rising wedges, in contrast, are bounded by two lines, both of which slope upward. The slope of the bottom line is sharper than the slope of the top, so that the two lines eventually intersect. Figure 1 shows a classic rising wedge chart pattern formed in Pacific Scientific [PSX]. On February 6, 1996, newspapers reported that quarterly earnings for PSX were $0.26 compared with $0.30 of the year-ago period. On that news, the stock declined from a high of $23.50 on February 5 to a low of $18.75 three days later. The decline traversed both wedge boundary lines at the left side of the formation.

The stock moved up as it recovered. However, on March 29, the Nightly Business Report television show reported that the company warned of earnings estimates that were too high. At two-thirds of the way to the wedge apex, the stock tumbled 21/8 on the news. The decline is shown in Figure 1 as the first daily price range leaving the chart formation on the right. In succeeding days, stock prices recovered somewhat in a scallop formation during the April-May period before continuing to decline on the way down to about 10 in recent days.
RISING WEDGE CHARACTERISTICS
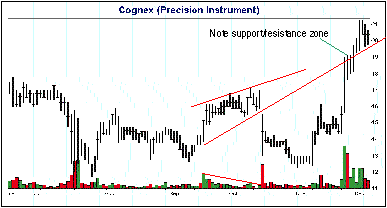
A few examples easily demonstrate the characteristics of rising wedges. The stock of Cognex Corp. [CGNX], pictured in Figure 2, broke down out of the rising wedge formation after the report of disappointing earnings. Wall Street was looking for earnings of 19 cents, but the company reported only 8 cents a share, including a one-time charge of more than $10 million. The stock declined 2-3/8 to 14-1/2 on the news. Investors who were well-versed in technical analysis and who owned the stock could have recognized the rising wedge and sold the stock before the decline began. The volume trend was downward as wedge prices rose. On the day of the downside breakout, volume rose substantially to 1,602,000 shares traded, up from a mere 10,000 shares two days prior.
