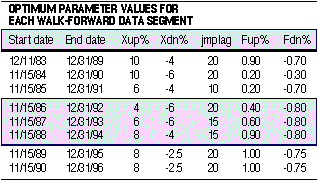
Previously, I examined the relationship between the Philadelphia Stock Exchange (PHLX) daily gold and silver stock index (XAU) and the Fidelity Long-Term Government Bond Fund (FGOVX). In that article, I used a walk-forward optimization technique to determine the system parameters. The data window for the research began on December 19, 1983, and ended December 31, 1995. This article will update the system parameters with a data window ended December 31, 1996.
WALK-FORWARD OPTIMIZATION
Why the walk-forward method? The daily data used for this article spans only 13 years. In terms of market history, 13 years is a very short period. Ideally, 20 to 40 years of data is needed in system development; the longer the period available for review, the better. This amount of data is necessary to split the data for testing using in-sample and out-of-sample segments. We must have enough data in the testing segment to model most, if not all, possible variations of the price dynamics. Of course, this assumes that the price dynamics in the future will not be too different from those in the past.
DATA DISCUSSION
The XAU is available on a daily basis from December 19, 1983, and is quoted daily in most financial newspapers. Historical data can be obtained from many computer data services. The Fidelity Government Bond Fund (FGOVX) will be used as the long-term government bond fund. I chose FGOVX simply because the daily data for this fund is readily available going back to 1982, and it is representative of long-term government bond rates. FGOVX prices have been adjusted for capital gains distributions but not for monthly interest distributions. The monthly interest distributions are not counted in the net asset value of the fund and do not affect the fund price when distributed.

Figure 1 presents the eight window data segments and their corresponding optimum parameter values. The parameter values change from segment to segment, verifying that a period of six years is not enough data to produce parameter values that are stable over time and that capture all the price dynamics.