Tape reading isn't terribly complicated. In Reminiscences of a Stock Operator, Edwin LeFèvre said it best: "This matter of tape reading is not so complicated as it appears. Of course you need experience. The object of reading the tape is to ascertain, first, how and next when to trade - that is, whether it is wiser to buy than sell. You watch the market -- that is, the course of prices as recorded by the tape -- that is, the price tendency."
Two key issues for traders here. First, the objective of reading the tape is to discover whether you should buy or sell. But in an understated, yet equally important manner, LeFèvre avers that you need experience to become a profitable tape reader.
COMPUTERS?
Nowadays, though, most traders no longer use the tape to determine patterns of behavior in the markets. They simply don't want to spend the years required to gain this skill. Instead, they look for shortcuts, relying on number-crunching historical data in sophisticated computer programs and developing mechanical systems based on the past behavior of the markets. In too many cases, the careers of traders are short-lived, or worse, marred by years of depressing losses as those traders continue searching for a magic potion that just doesn't exist, never being able to adapt to the ever-changing nature of the markets.
Nowhere is this futile quest for instant wealth more evident than among daytraders in stock futures. Seduced by visions of turning on their personal computers and effortlessly making thousands of dollars weekly by daytrading the Standard & Poor's 500 stock index, novice market participants have flocked to trading stock futures. Unfortunately, very few home-based traders ever succeed daytrading these markets using their computers.
REAL-TIME TRADING
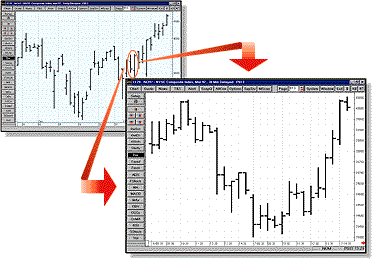
To illustrate how I use these patterns to read the tape, let me walk you through how I traded the NYSE Composite Index futures contract on January 6 and 7, 1997 (Figure 1). [Editor's note: Gary Smith trades using tape information presented throughout the day on the CNBC cable network. We are presenting charts to illustrate his analysis.]

On Monday, January 6, after a little over an hour of trading, the stock market was in a strong uptrend. The DJIA was up 44 points and the NASDAQ index was up more than 8 points. In addition, one of my favorite mechanical systems triggered a long trade at 9:43 CST. This occurred when the S&P futures broke out to new intraday highs by rising above the highs that had been set during the first 50 minutes of trading. The only warning flag I saw with my tape indicators was the S&P cash, which was lagging behind the DJIA and was up only 3.43 points. This divergence was enough to prevent me from taking a long position, but not quite enough to get me to press the short side. With the futures setting new highs, I wanted to see not only some setback in the futures before shorting, but also some weakening in my other tape indicators.