With each technical analysis software package comes a host of technical indicators, yet more often than not, the manual accompanying the package only provides a series of one-page guidelines describing how to use each indicator. So here's a more in-depth look at a particular indicator that's often found in those packages, one that for the most part is overlooked but has a real use for the technician: The triple exponential smoothing oscillator (TRIX). The value of TRIX as an oscillator lies in that it is a leading indicator, whereas other technical tools are generally lagging indicators. TRIX leads a market because it uses a differencing function -- after smoothing the data to reduce the impact of noise around the trend, the difference between each day's smoothed version of the closing prices is measured.
DETAILED TRIX
TRIX is an oscillator that rises and falls around a center (zero) line. One of its applications is in establishing a position when the indicator changes direction. You can also take positions when the indicator crosses the zero line. Using TRIX as a trend-following indicator, one can buy when the indicator closes above the zero line or sell when it closes below the zero line. I recommend that you adjust different time periods to use with TRIX; the higher value you use for the lookback periods, the more lag you introduce. Look at different time frames and decide which one works best. I personally feel that a shorter period is best for my purposes. I use a three-period TRIX, and thus, all noise shorter than three days' duration should be filtered out.
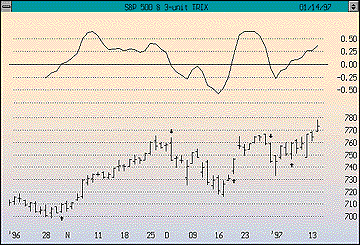
Now let's look at some signals based on a crossover of the zero line using a three-period TRIX. Figure 1 is the daily Standard & Poor's 500 from October 17, 1996, through January 14, 1997. As you can see, the indicator caught the big move up from 708.00 to 760.00. These basic signals aren't really that bad; with a little fine-tuning, a good trend-following system can be created.

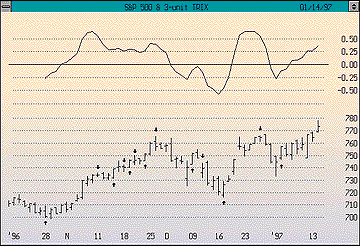
In Figure 2, we have the same chart, only the signals are based on the change of direction of the indicator. When the indicator goes from rising to falling, a sell signal is issued, and when the indicator goes from falling to turning up, a buy signal is issued. As you can see, there is a period during November 1996 where you would have been whipsawed. By increasing the number of periods used in the indicator, some of the noise can be filtered out. However, signals tend to lag, and sometimes a notable move occurs before you get a signal.
