Here, in part 1 of two, these Contributing Writers explain the steps necessary to evaluate trading system behavior with the use of statistics.
Most systems I have seen are simply optimized by being tested with different parameters, examined for profitability and sometimes assessed for a few other characteristics. On occasion, I have encountered systems tested on perhaps one or two out-of-sample periods to determine whether performance would hold up. However, few who write about system development or developers themselves have attempted to estimate probabilities or compute statistical analyses on trading systems to assess likely future system performance. For the sake of simplicity, I have often been guilty of omitting such analyses from my own work.
However, I often get comments regarding issues that statistics directly bear upon, such as sample size, replicability, curve-fitting, generalization and determining whether a system will trade profitably or fall apart when finally put to the test. I have also had discussions with system developers who are reluctant to apply any optimization strategy because of a fear of curve-fitting rooted in a lack of knowledge about the statistical issues involved.
WHY?
Why use statistics to evaluate trading systems? One important reason is because traders need to determine the likelihood that systems will hold up when they are used in actual trading. While out-of-sample testing (when systems are tested on data that haven't been used in their development) can provide some indication as to whether systems will hold up on new (future) data, statistical methods can provide additional information and probability estimates.
Why use statistics to evaluate trading systems? One important reason is because traders need to determine the likelihood that systems will hold up when they are used in actual trading.
Example 1
Evaluating an unoptimized system
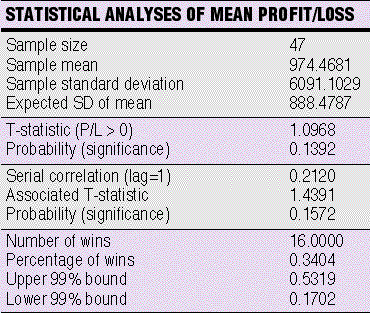
Evaluating an unoptimized system is the same as evaluating an optimized one on out-of-sample data not seen during the optimization process. In both cases, you're running one test on a system without tweaking any parameters. To illustrate the use of statistics to evaluate an unoptimized system, look at Figure 2, where the out-of-sample test data may be found together with a variety of statistics.


Figure 2: The use of statistics to evaluate an unoptimized system. Evaluating an unoptimized system is the same as evaluating an optimized one on out-of-sample data not seen during the optimization process. In both cases, you're running one test on a system without tweaking any parameters. Here, the out-of-sample test data may be found together with a variety of statistics.
In the test, I am using data that was not seen when the system's parameters were adjusted, and now, with a fixed set of parameters, I am running the system once on this fresh set of data. Therefore, imagine, for the moment, that there is an unoptimized system that will be statistically evaluated.

