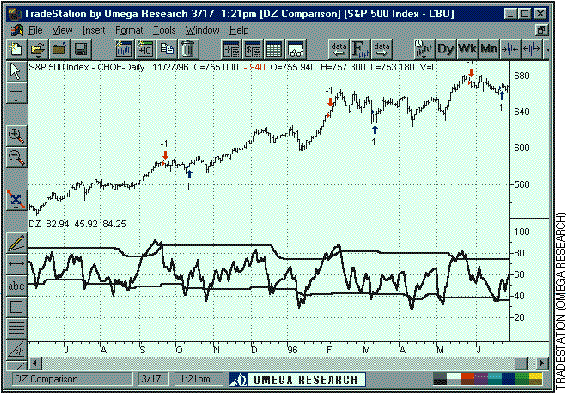
Most indicators use a fixed zone for buy and sell signals. Here's a concept based on zones that are responsive to past levels of the indicator.
One approach to active investing employs the use of oscillators to exploit tradable market trends. This investing style follows a very simple form of logic: Enter the market only when an oscillator has moved far above or below traditional trading levels. However, these oscillator-driven systems lack the ability to evolve with the market because they use fixed buy and sell zones. Traders typically use one set of buy and sell zones for a bull market and substantially different zones for a bear market. And therein lies the problem.
Once traders begin introducing their market opinions into trading equations, by changing the zones, they negate the system's mechanical nature. The objective is to have a system automatically define its own buy and sell zones and thereby profitably trade in any market -- bull or bear. Dynamic zones offer a solution to the problem of fixed buy and sell zones for any oscillator-driven system.
CALCULATING THE DYNAMIC ZONES
The algorithm for the dynamic zones is a series of steps. First, decide the value of the lookback period t. Next, decide the value of the probability Pbuy for buy zone and value of the probability Psell for the sell zone.

Figure 1 illustrates the buy and sell zones for the Standard & Poor's 500 market using a nine-day relative strength indicator (RSI). The area above and below the dynamic zones constitute the upper and lower 10% boundaries. The zones appear to evolve with the market because they use a rolling 70-day period of indicator values in their construction.Figure 1: Buy and sell zones, S&P 500. Figure 1 illustrates the buy and sell zones for the Standard & Poor's 500 market using a nine-day relative strength indicato. The area above and below the dynamic zones constitute the upper and lower 10% boundaries. The zones appear to evolve with the market because they use a rolling 70-day period of indicator values in their construction.