July 1997
Letters to the Editor
POINT & FIGURE CHARTINGEditor,
Concerning Daryl Guppy's March 1997 article ("Building point & figure charts"), the one-box point & figure chart was created incorrectly. When the reversal is one unit, you do not always move one column to the right. The only reason to move one column to the right in any P&F chart is to avoid overwriting the Xs or Os in the current column. You will always need to move to the right in reversal charts of two, three, five or more units, but not with one-unit reversal charts. For example, if the price reverses by only one unit and then reverses back again, you do not move one column to the right each time.Some commercial technical analysis programs draw one-unit reversal charts the same way as for reversal charts of three units, which contributes to the incorrect method becoming the standard. But any quality textbook on one-unit reversal P&F charts will confirm the correct method.
One-unit charts are the only P&F charts that can have an X and an O in the same column.
LES WEBSTERDaryl Guppy replies:
via E-mail
The strictly classic approach to point & figure charting shows important structural inconsistencies -- such as a special rule for one-box charts with one-box reversals -- which in any case, as I noted in the article, are rarely useful for trading purposes.As an aid to understanding the construction and trading application of P&F, I chose to apply the construction rules (that is, the rule that states when the direction of price changes by the designated box reversal, you move to the right and start a new column) consistently to all examples. The consistent application of these rules makes P&F particularly useful in identifying support, resistance and trendlines.
In my experience with P&F -- and I have been using it successfully as a trading approach for many years -- is that when P&F charts are constructed with a mixture of Xs and Os in the same column, they fail to give useful trading signals. They miss trend breakouts, underestimate the strength of support and resistance, and distort the development and completion of triangle patterns. A consistent application of the rules to all box and reversal sizes gives consistent trading information.
The bibliography on point & figure charting that belatedly appeared in the June 1997 Letters to S&C provided additional followup information for readers who want to explore the development of P&F and see how far we have moved. But every quality text on point & figure, from the classics to the more innovative approaches, gives the reason for starting a new column as when the price changes direction. (Incidentally, the assertion that one-unit charts are the only P&F charts that can have an X and an O in the same column does not stand closer scrutiny.)
Regarding the application of P&F in technical analysis programs, some charting programs do adhere to the classic approach, but markets move on. The user must decide if the classic approach helps or hinders effective trading. You can decide this, as I suggested in the article, by setting the P&F chart parameters to match known trading opportunities on the bar chart. The P&F parameters will remain consistent over time.
In sum, no P&F approach -- classic, modern, or postmodern -- can claim an absolute truth: It is only "right" if it helps you trade better.
Editor,
S&C GLOSSARY
I thought I had a printed copy of your Traders' Glossary that I received as a bonus when I subscribed. But I can't find it. Did I make this up out of wishful thinking? Did you publish the glossary? Can I get a copy?Kudos for a great magazine.
JIM McCAMPBELLThe complete Traders' Glossary appeared on pages 60-77 of our 1997 Bonus Issue, which was distributed to all current, paid subscribers in December 1996. New paid subscribers throughout the year will also receive a copy of the Bonus Issue. Call our circulation department at 800 832-4642 or 206 938-0570 for more information. -- Editor
via E-mail
Editor,
CONTINUOUS CONTRACTS
As a longtime subscriber, I want to thank you for an excellent publication. The April 1997 issue was simply outstanding. Every article contained useful information that could be applied immediately, from trading psychology to developing a trading system. Your interview with John Bollinger and the article by Victor ("Trader Vic") Sperandeo were especially pertinent.I do have a one question concerning Alex Saitta's article on bond trading ("Bonds, price momentum and trends"). He refers to a "continuous T-bond adjusted for the rollover of each contract." Is this adjustment simply the addition or subtraction of the price difference between the expiring contract and the new contract applied back through the entire collection of data? Also, what effect does this adjustment have on support and resistance points?
KENNETH A. HOUGH
Durham, NCSaitta uses a continuous T-bond contract adjusted for the rollover of each contract. The adjustment is made backwards from today's current data. At the rollover date, the difference between the current and the previous contracts is added to all the previous data if the difference is negative. If the difference is positive, then the difference is subtracted from all the previous data.
The historical trading levels of this adjusted contract are very different from the actual traded prices, and thus, they should not be used for support and resistance points. Rather, an unadjusted price series that shows actual historical trading levels should be used for determining support and resistance points. -- Editor
Editor,
TWO PLUS TWO
I saw the following statement on page 94 of Victor Sperandeo's April 1997 S&C article, "The essence of market profits":"If making big returns is the goal, 100% in an S&P 500 index fund, 50% in managed futures -- using leverage and thus assuming added risk -- would be the optimum mix for the best performance."Was this an error, given that the two percentages cited here don't add up to 100%?BRIAN SIMBOLIDepending on your brokerage firm, you may be able to margin (borrow against) your index fund and use those proceeds to invest in managed futures. Thus, 150% refers to a leveraged position. -- Editor
via E-mail
Editor,
THE IMPORTANCE OF TRADING PSYCHOLOGY
I very much enjoy your magazine and read almost all of it from cover to cover each month, even though I don't yet understand the more technical articles. I've only been studying the futures markets for about a year.I'm currently developing a business based on trading mechanical systems. My main focus has been on the psychological aspects of trading and on what I need to change inside myself before I ever think about placing an order. I just wanted to say thanks for the great articles about this part of the trading game, especially the ones by Adrienne Laris Toghraie. Her insights are a tremendous help.
TIM PUTNAM
via E-mail
Editor,
POSITIVE EFFECT
Just a quick note to let you know how much I enjoy reading STOCKS & COMMODITIES. The articles are very informative and I look forward to them every month. I particularly enjoyed David Landry's article, "The 2/20-day EMA breakout system," in the December 1996 issue. The article was extremely well done, and the 2/20 system has had a very positive effect on my trading.JOE CALANDROThanks for writing. -- Editor
via E-mail
Editor,
DATABASE CONVERSION
I'm searching for software that can merge stock data from different sources. I have two databases, one of which is in French-language software in a proprietary format. I've tried using the macro command functions in my spreadsheet software, but I can only manage to export one stock at a time, which is too time-consuming. My technical analysis programs can't read the data from the proprietary database. I've checked your magazine for software ads, but I didn't find any products that seemed to offer conversion capabilities. Do you know of any software that can merge data from different databases?I also want to express my admiration for your magazine. It's very interesting and the quality of the articles is very high. Same goes for the writing style. With each issue, I see continual improvement.
RENALD MARCHAND
Québec, CanadaI can't provide any software recommendations but maybe someone reading this can. -- Editor
Editor,
ERRATA
I believe there is an error in the LowPass Filter code given in Figure 11 on page 51 of the article "Cycles and trading systems" (May 1997): Line 11; damp2=0.45. This code conflicts with the code in lines 9 and 10.DON KRASKAJeffrey Katz replies:
via E-mail
To begin with, I must commend the astute readership of S&C for catching some apparent errors, as well as real problems, with the discussion of the Butterworth filters and the code for the four-pole low-pass Butterworth filter in my May 1997 article, "Cycles and trading systems."Some readers noted that the variable damp2, after having been set in an if...then...else statement, was immediately overwritten with a new value. This is more of an apparent error than a real one. While tweaking the code during its development, I decided to try another model for estimating the appropriate value for the second damping factor. Rather than deleting the earlier code, I simply added a line that set the damping factor to the value derived from the newer model. Consequently, the final code may not have been very elegant, but it's a legacy of the development process. I sometimes write code in this way when I am playing with several variants on a particular way of computing something; usually, however, I clean up the code in the final version. This fragment slipped through the cleanup process.
On the other hand, a number of readers also detected a real problem in the article. When a DC (constant value) signal is passed through the low-pass filter shown in the article, the output, instead of stabilizing at a value equal to the input, stabilizes at an offset relative to the input. In the real world, this problem is especially noticeable for input data series that have large DC offsets, for example, the closing prices of the S&P 500 that hover in the 700s. This is due to two factors: first, the single-precision accuracy of TradeStation's arithmetic, and second, the particular characteristics of the filter that were optimized.
Regarding the first: When developing the filters, I worked in C++ and used double-precision arithmetic. I did not check the algorithm for sensitivity to small roundoff errors. It appears that when dealing with signals with large DC offsets, the accumulation of single-precision roundoff errors in the recursive calculations are sufficient to render the results useless. With relatively centered data (low DC offset), the filter performs as it should, even in single precision.
With regard to the second, the filter was evolved (using a genetic algorithm) to provide as close an approximation to the correct frequency/periodicity response as possible, even under conditions of coarse sampling, where the spacing between bars approaches a sizable percentage of the center periodicity of the filter. The "fitness" or evaluation function used in designing the filter placed major emphasis on niceness of filter impulse and frequency response, and little emphasis on offsets and gain. I compensated a little for gain, but ignored offset. This was perfectly acceptable given the way I intended to use the filter - in conjunction with a high-pass filter in order to achieve a band-pass response, where my main concern was with phase shift and frequency response. However, for other uses, the offsets may not be acceptable and will need to be compensated for.
Another real error was more along the lines of a brain glitch on my part: Throughout the text of the article I kept referring to three-pole Butterworth filters, whereas in the code, the comments indicate a four-pole Butterworth filter. In fact, the code is for a four-pole filter. Somehow, when writing the article, I forgot this fact and assumed I was using a three-pole filter. The difference is that a four-pole filter will have a somewhat sharper cutoff in the stop-band (24 db per octave) than that of a three-pole filter (18 db per octave) at the expense of a greater lag.
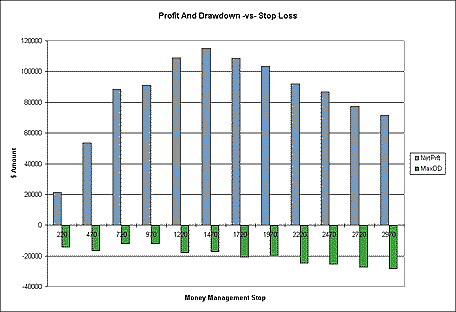
FIGURE 6: PROFIT AND DRAWDOWN VS. STOP-LOSS. As the stop was reduced from $2,970 to $1,470 (x-axis), the profits increased and the drawdowns decreased. Finally, S&C made an error of its own: One graph was printed twice, once as Figure 4 and again as Figure 6. In fact, Figure 6 should have been a graph of the profit and drawdown versus the protective stop. Also, the boldface text under Figure 6 is incorrect, while the rest of the descriptive text is correct. The correct graph is reprinted here.
While this article drew a good deal of positive response (in addition to the corrective comments), it also seems to be the first article of the series to have been brutally subject to Murphy's Law. We'll all try our best to curtail such phenomena in the future.
ERRATA
On pages 68 and 70 of May 1997, in our sidebar titled "Technical indicators" that ran alongside our interview with Jay Kaeppel, several errors occurred. First, the paragraph with the heading "Initial discount rate cut" should not have referred to sidebar Figure 1. Next, in the paragraph under the heading "Stock/bond yield gap," the second "if" statement should have read "If c<=-0.02, then sell." Next, the equation under the heading "DJIA 11-month weighted rate-of-change" appeared incorrectly. The correct equation should have read:
(((DJIA Close / DJIA Close 11 months ago)-1)*100) * 10
+(((DJIA Close 1 month ago/DJIA Close 12 months ago)-1)*100) * 9
+(((DJIA Close 2 months ago/DJIA Close 13 months ago)-1)*100) * 8
+(((DJIA Close 3 months ago/DJIA Close 14 months ago)-1)*100) * 7
+(((DJIA Close 4 months ago/DJIA Close 15 months ago)-1)*100) * 6
+(((DJIA Close 5 months ago/DJIA Close 16 months ago)-1)*100) * 5
+(((DJIA Close 6 months ago/DJIA Close 17 months ago)-1)*100) * 4
+(((DJIA Close 7 months ago/DJIA Close 18 months ago)-1)*100) * 3
+(((DJIA Close 8 months ago/DJIA Close 19 months ago)-1)*100) * 2
+(((DJIA Close 9 months ago/DJIA Close 20 months ago)-1)*100) * 1
Finally, under the heading "Gold mining index 12-month ROC," the two "if" statements should have read:
If a < 0 for 13 straight weeks or a <= -35%, buy long-term bonds.
If a > 0 for 13 straight weeks or a >= +35%, sell long-term bonds.