July TRADERS' TIPS

Here is this month's selection of Traders' Tips, contributed by various developers of technical analysis software to help readers more easily implement some of the strategies presented in this issue.

You can copy these formulas and programs for easy use in your spreadsheet or analysis software. Simply "select" the desired text by highlighting as you would in any word processing program, then use your standard key command for copy or choose "copy" from the browser menu. The copied text can then be "pasted" into any open spreadsheet or other software by selecting an insertion point and executing a paste command. By toggling back and forth between an application window and the open Web page, data can be transferred with ease.

This month's tips include formulas and programs for:

TRADESTATION
METASTOCK
TECHNIFILTER PLUS
SMARTRADER
WAVEWI$E MARKET SPREADSHEET

or return to July Contents

TRADESTATION

In the article "Rainbow charts," author Mel Widner introduces a colorful technique for plotting an oscillator to signal trend changes. The oscillator is derived from a consensus of trends that, when plotted in color, has the appearance of a rainbow.

Using a few studies and functions in TradeStation, the rainbow lines and rainbow oscillator can be developed in Easy Language. As always, the functions should be developed first. For the indicators themselves, special formatting is required for each. An outline of the recommended format is given after each set of indicator code.
Below is the Power Editor code for the first function, "Rainbow." This function performs the basic calculations for the moving averages that make up the rainbow.


Type: Function
Name: rainbow

Inputs: Price(Numeric), Length(Numeric), Level(Numeric);
Vars: LVLAvg(0);
Array: Avg[10](0);

Avg[1] = Average(Price, Length);
Avg[2] = Average(Avg[1], Length);
Avg[3] = Average(Avg[2], Length);
Avg[4] = Average(Avg[3], Length);
Avg[5] = Average(Avg[4], Length);
Avg[6] = Average(Avg[5], Length);
Avg[7] = Average(Avg[6], Length);
Avg[8] = Average(Avg[7], Length);
Avg[9] = Average(Avg[8], Length);
Avg[10] = Average(Avg[9], Length);

For value1 = 1 To 10 Begin
   IF value1 = Level Then
      LVLAvg = Avg[value1];
End;

Rainbow = LVLAvg;
 

The next function is "RainbowBW." This function returns the bandwidth of the averages:


Type: Function
Name: RainbowBW

Inputs: Price(Numeric), Length(Numeric), Level(Numeric);
Vars: LVLAvg(0), HiPrice(0), LoPrice(0), HiAvg(0), LoAvg(0);
Array: Avg[10](0);

Avg[1] = Average(Price, Length);
Avg[2] = Average(Avg[1], Length);
Avg[3] = Average(Avg[2], Length);
Avg[4] = Average(Avg[3], Length);
Avg[5] = Average(Avg[4], Length);
Avg[6] = Average(Avg[5], Length);
Avg[7] = Average(Avg[6], Length);
Avg[8] = Average(Avg[7], Length);
Avg[9] = Average(Avg[8], Length);
Avg[10] = Average(Avg[9], Length);

HiPrice = Highest(Price, Level);
LoPrice = Lowest(Price, Level);
HiAvg = Avg[1];
LoAvg = Avg[1];
For value1 = 2 To Level Begin
   IF Avg[value1] > HiAvg Then
      HiAvg = Avg[value1];
   IF Avg[value1] < LoAvg Then
      LoAvg = Avg[value1];
End;

IF HiPrice - LoPrice <> 0 Then Begin
   IF Price > HiAvg Then
      HiAvg = Price;
   IF Price < LoAvg Then
      LoAvg = Price;
   RainbowBW = 100 * ((HiAvg - LoAvg) / (HiPrice - LoPrice));
End;

The third and final function is "RainbowOsc." This function returns the value of the rainbow oscillator calculation:


Type: Function
Name: RainbowOsc

Inputs: Price(Numeric), Length(Numeric), Level(Numeric);
Vars: AvgAvgs(0), HiPrice(0), LoPrice(0), AvgVal(0);
Array: Avg[10](0);

AvgAvgs = 0;
Avg[1] = Average(Price, Length);
Avg[2] = Average(Avg[1], Length);
Avg[3] = Average(Avg[2], Length);
Avg[4] = Average(Avg[3], Length);
Avg[5] = Average(Avg[4], Length);
Avg[6] = Average(Avg[5], Length);
Avg[7] = Average(Avg[6], Length);
Avg[8] = Average(Avg[7], Length);
Avg[9] = Average(Avg[8], Length);
Avg[10] = Average(Avg[9], Length);

HiPrice = Highest(Price, Level);
LoPrice = Lowest(Price, Level);
For value1 = 1 To Level Begin
   AvgAvgs = AvgAvgs + Avg[value1];
End;
AvgVal = AvgAvgs / Level;

IF HiPrice - LoPrice <> 0 Then
   RainbowOsc = 100 * ((Close - AvgVal) / (HiPrice - LoPrice));
 

As for the indicators themselves, there are a total of four. For the most part, the indicator code is simple. The first three indicators (Rainbow_a, Rainbow_b and Rainbow_c) are used to plot the rainbow lines 1 through 10 on the chart. If you prefer to have only eight rainbow lines on the chart, then only "Rainbow_b" and "Rainbow_c" would be plotted. For all indicators, the "P" input represents the price basis of the moving average lines. The "Len" input represents the number of bars that are referenced by the moving average calculations. For the rainbow oscillator, the "Levels" input represents the number of average levels that are to be used for the calculation (default = 10). As noted earlier, all four indicators require special format settings for them to appear correctly on the chart. The format settings for each indicator follow each set of indicator code.


Type: Indicator
Name: Rainbow_a

Inputs: P(Close), Len(2);

IF CurrentBar > Len * 10 Then Begin
  Plot1(Rainbow(P, Len, 10), "Avg10");
  Plot2(Rainbow(P, Len, 9), "Avg9");
End;

Style:
  Plot  Name  Type  Color   Weight
  Plot1  Avg10  Line   Dk Blue   medium
  Plot2  Avg9   Line  Dk Magenta medium
Scaling: Same as Price Data


Type: Indicator
Name: Rainbow_b

Inputs: P(Close), Len(2);

IF CurrentBar > Len *10 Then Begin
  Plot1(Rainbow(P, Len, 8), "Avg8");
  Plot2(Rainbow(P, Len, 7), "Avg7");
  Plot3(Rainbow(P, Len, 6), "Avg6");
  Plot4(Rainbow(P, Len, 5), "Avg5");
End;

Style:
  Plot   Name  Type  Color   Weight
  Plot1   Avg8   Line  Dk Green   medium
  Plot2   Avg7   Line  Dk Cyan    medium
  Plot3   Avg6   Line   Blue
  Plot4   Avg5   Line   Cyan
Scaling: Same as Price Data


Type: Indicator
Name: Rainbow_c

Inputs: P(Close), Len(2);

IF CurrentBar > Len *10 Then Begin
  Plot1(Rainbow(P, Len, 4), "Avg4");
  Plot2(Rainbow(P, Len, 3), "Avg3");
  Plot3(Rainbow(P, Len, 2), "Avg2");
  Plot4(Rainbow(P, Len, 1), "Avg1");
End;

Style:
  Plot  Name  Type  Color   Weight
  Plot1  Avg4   Line   Green    medium
  Plot2  Avg3   Line  Yellow    medium
  Plot3  Avg2   Line  Magenta   medium
  Plot4  Avg1   Line    Red     medium
Scaling: Same as Price Data

The final indicator is the rainbow oscillator. The following indicator code plots the rainbow oscillator and the upper/lower bandwidth lines.


Type: Indicator
Name: Rainbow Oscillator

Inputs: P(Close), Len(2), Levels(10);
Vars: PosNeg(0);

IF CurrentBar > Len * Levels Then Begin
  Plot1(RainbowBW(P, Len, Levels), "URB");
  Plot2(-RainbowBW(P, Len, Levels), "LRB");
  PosNeg = RainbowOsc(P, Len, Levels);

  IF PosNeg > 0 Then
      Plot3(PosNeg, "RainbowOsc")
  Else
      Plot4(PosNeg, "RainbowOsc");
End;

Style:
  Plot   Name    Type    Color  Weight
  Plot1   URB       Line      Red    medium
  Plot2   LRB       Line      Blue   medium
  Plot3  RainbowOsc Histogram Red    medium
  Plot4  RainbowOsc Histogram    Blue   medium
Scaling: Screen
Properties: Subgraph 2

This code is available at Omega Research's Web site. The file name is "Rainbow.ELA."


-- Gaston Sanchez, Omega Research
800 422-8587, 305 270-1095
Internet: https://www/omegaresearch.com

GO BACK

METASTOCK

To create rainbow charts in MetaStock for Windows, open any chart, drag the moving average indicator from the Indicator QuickList, and drop it in the same inner windows as the price bars. Enter "2" for the period and "simple" for the method. Next, plot a second moving average over the first moving average by dragging a moving average from the QuickList and dropping it onto the first moving average (the first moving average should turn light purple before you release the mouse button). If you dropped it correctly, the Parameters dialog should read "indicator" for the Price Field. Click OK to accept two periods and "simple" as the parameters.

Next, change the color of this moving average as desired. Now plot a third moving average of the second moving average by repeating these steps. Continue this until you have 10 moving averages. Choose "yes" if MetaStock prompts you about plotting a duplicate indicator.

To save time, I created a template that allows you to bypass these steps. You can download this template from the Equis Web site at www.equis.com/customer/files/files.html. Download this file to the Charts folder (for example, C:\Equis\Mswin\Charts) in your MetaStock folder. Open any chart and then click your right mouse button while the pointer is on the chart. Choose "apply template" from the Chart Shortcut and choose the Rainbow Chart template. You should now have a chart with 10 differently colored moving averages.

Next, choose "indicator builder" from the Tools menu and enter the following formulas:


Rainbow Max

Max(Mov(C,2,S),
Max(Mov(Mov(C,2,S),2,S),
Max(Mov(Mov(Mov(C,2,S),2,S),2,S),
Max(Mov(Mov(Mov(Mov(C,2,S),2,S),2,S),2,S),
Max(Mov(Mov(Mov(Mov(Mov(C,2,S),2,S),2,S),2,S),2,S),
Max(Mov(Mov(Mov(Mov(Mov(Mov(C,2,S),2,S),2,S),2,S),2,S),2,S),
Max(Mov(Mov(Mov(Mov(Mov(Mov(Mov(C,2,S),2,S),2,S),2,S),2,S),2,S),2,S),
Max(Mov(Mov(Mov(Mov(Mov(Mov(Mov(Mov(C,2,S),2,S),2,S),2,S),2,S),2,S),2,S),2,S),
Max(Mov(Mov(Mov(Mov(Mov(Mov(Mov(Mov(Mov(C,2,S),2,S),2,S),2,S),2,S),2,S),
2,S),2,S),2,S),
Mov(Mov(Mov(Mov(Mov(Mov(Mov(Mov(Mov(Mov(C,2,S),2,S),2,S),2,S),2,S),2,S),2,S),2,S),
2,S),2,S))))))))))

Rainbow Min

Min(Mov(C,2,S),
Min(Mov(Mov(C,2,S),2,S),
Min(Mov(Mov(Mov(C,2,S),2,S),2,S),
Min(Mov(Mov(Mov(Mov(C,2,S),2,S),2,S),2,S),
Min(Mov(Mov(Mov(Mov(Mov(C,2,S),2,S),2,S),2,S),2,S),
Min(Mov(Mov(Mov(Mov(Mov(Mov
(C,2,S),2,S),2,S),2,S),2,S),2,S),
Min(Mov(Mov(Mov(Mov(Mov(Mov(Mov
(C,2,S),2,S),2,S),2,S),2,S),2,S),2,S),
Min(Mov(Mov(Mov(Mov(Mov(Mov(Mov(Mov
(C,2,S),2,S),2,S),2,S),2,S),2,S),2,S),2,S),
Min(Mov(Mov(Mov(Mov(Mov(Mov(Mov(Mov(Mov
(C,2,S),2,S),2,S),2,S),2,S),2,S),2,S),2,S),2,S),
Mov(Mov(Mov(Mov(Mov(Mov(Mov(Mov(Mov(Mov
(C,2,S),2,S),2,S),2,S),2,S),2,S),2,S),2,S),2,S),2,S))))))))))

Rainbow Oscillator

100 *
(CLOSE - ((Mov(C,2,S) +
Mov(Mov(C,2,S),2,S) +
Mov(Mov(Mov(C,2,S),2,S),2,S) +
Mov(Mov(Mov(Mov(C,2,S),2,S),2,S),2,S) +
Mov(Mov(Mov(Mov(Mov(C,2,S),2,S),2,S),2,S),2,S) +
Mov(Mov(Mov(Mov(Mov(Mov(C,2,S),2,S),2,S),2,S),2,S),2,S) +
Mov(Mov(Mov(Mov(Mov(Mov(Mov(C,2,S),2,S),2,S),2,S),2,S),2,S),2,S) +
Mov(Mov(Mov(Mov(Mov(Mov(Mov(Mov
(C,2,S),2,S),2,S),2,S),2,S),2,S),2,S),2,S) +
Mov(Mov(Mov(Mov(Mov(Mov(Mov(Mov(Mov
(C,2,S),2,S),2,S),2,S),2,S),2,S),2,S),2,S),2,S) +
Mov(Mov(Mov(Mov(Mov(Mov(Mov(Mov(Mov(Mov
(C,2,S),2,S),2,S),2,S),2,S),2,S),2,S),2,S),2,S),2,S)) / 10)) /
(HHV(C,10) - LLV(C,10))

Lower Rainbow Band

-100 *
(Fml("Rainbow Max") - Fml("Rainbow Min")) /
(HHV(C,10) - LLV(C,10))

Upper Rainbow Band

100 *
(Fml("Rainbow Max") - Fml("Rainbow Min")) /
(HHV(C,10) - LLV(C,10))
 

Plot the rainbow oscillator in a new inner window of your chart with the 10 moving averages by dropping the custom indicator from the QuickList onto the chart's heading. Right-click on the rainbow oscillator and choose properties, then change the style to a histogram. Now plot the lower rainbow band and the upper rainbow band in the same inner window as the rainbow oscillator. If the scaling dialog appears when plotting these indicators, choose "Merge with scale on right." Change the colors of the upper and lower rainbow bands as desired. Save this as a new template by choosing Save As from the File menu and changing the File Type to template so you can apply it to any chart.

-- Allan J. McNichol, EQUIS International
800 882-3040, 801 265-8886
Internet: https://www.equis.com

GO BACK


TECHNIFILTER PLUS

Here's a TechniFilter Plus report for plotting Mel Widner's rainbow oscillator. Formulas 1 through 10 define the family of moving averages that form the basis of the chart. To create the rainbow appearance for the averages, overlay formulas 1 through 10 on a line chart using the same scale setting. To view the same information in less clutter, overlay only formulas 1, 2 ,3 and 8, 9, 10. Formulas 11 and 12 compute RangeA and RangeC. Formula 13 computes the bandwidth, RB. Formula 14 computes the average of the averages, AveA. Formula 15 computes the rainbow oscillator, RO.


report ID: WIDNER report title: RAINBOWS compress: N
# of columns: 15 use name or ticker?: T units to read: 100

1.  title: AVE1      format: #####.##
    formula: CA2
2.  title: AVE2      format: #####.##
    formula: CA2A2
3.  title: AVE3      format: #####.##
    formula: CA2A2A2
4.  title: AVE4      format: #####.##
    formula: CA2A2A2A2
5.  title: AVE5      format: #####.##
    formula: CA2A2A2A2A2
6.  title: AVE6      format: #####.##
    formula: CA2A2A2A2A2A2
7.  title: AVE7      format: #####.##
    formula: CA2A2A2A2A2A2A2
8.  title: AVE8      format: #####.##
    formula: CA2A2A2A2A2A2A2A2 
9.  title: AVE9      format: #####.##
    formula: CA2A2A2A2A2A2A2A2A2
10. title: AVE10     format: #####.##
    formula: CA2A2A2A2A2A2A2A2A2A2
11. title: RANGEA    format: #####.##
    formula: ([1]%[2]%[3]%[4]%[5]%[6]%[7]%[8]%[9]%[10]) -
             ([1]#[2]#[3]#[4]#[5]#[6]#[7]#[8]#[9]#[10])
12. title: RANGEC    format: #####.##
    formula: CM10-CN10
13. title: RB        format: #####.##
    formula: 100*[11]/[12]
14. title: AVEA      format: #####.##
    formula: ([1]+[2]+[3]+[4]+[5]+[6]+[7]+[8]+[9]+[10])/10
15. title: RO        format: #####.##
    formula: 100*(C-[14])/[12]
This TechniFilter Plus strategy and the reports, strategies and formulas of earlier Traders' Tips can be downloaded from RTR's Web site.
-- Clay Burch, RTR Software
919 510-0608, E-mail: rtrsoft@aol.com
Internet: https://www.rtrsoftware.com
GO BACK


SMARTRADER

Mel Widner's rainbow charting technique is an excellent demonstration of how graphics can present information that might not be readily understood in a numerical format alone.

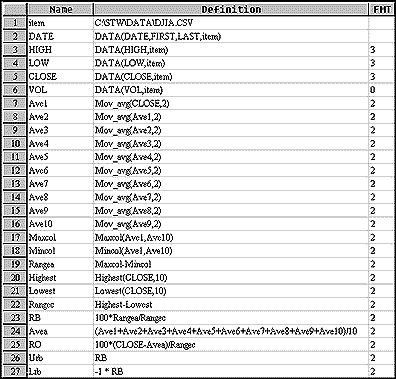
Constructing the calculations to produce the rainbow chart is straightforward and simple. In row 7 of the SmarTrader specsheet shown in Figure 1, Ave1 is a two-period simple moving average of the closing price. Here, we are using the Dow Jones Industrial Average (DJIA) from January 1980 to May 5, 1997, compressed into quarterly bars.

FIGURE 1: SMARTRADER SPECSHEET. This SmarTrader specsheet shows the rules for plotting rainbow charts.

Subsequently, Ave2 through Ave10 are two-period moving averages of the previous Ave(n). Row 17 determines the maximum value of Ave1 through Ave10 for each period. Row 18 determines the corresponding minimum value. RangeA is a simple subtraction of the two values. Row 20 determines the highest close over 10 periods. Row 21 determines the lowest over 10 periods. RangeC is the difference between the highest and lowest. In row 24, the 10 averages are added together and divided by 10 to produce an average of the averages. In row 26, Urb is made equal to RB, and in row 27, Lrb is made equal to the negative value of RB by multiplying by -1.

Graphically, it's easy to see how the rainbow is narrow when volatility is low and how it widens as volatility increases. Look at the chart in 1987 and 1990 to confirm this.

To create a chart based on all these calculations, Ave2 through Ave10 are plotted as lines of colors representing the colors of a rainbow. The close is plotted last to place it on top of the other lines. All lines are set to "thick" to enhance the appearance of the rainbow. Ave1 is omitted due to a program limit of 10 plots per window.

The SmarTrader specsheet file for creating rainbow charts is available from Stratagem's Web site.

-- Jim Ritter, Stratagem Software International
504 885-7353, E-mail: Stratagem1@aol.com
Internet: https://www.stratagem1.com
GO BACK


WAVEWI$E MARKET SPREADSHEET

In "Rainbow charts," Mel Widner presents a technique for plotting a trend-following oscillator in a rainbow of colors. Here are the WAVEWI$E spreadsheet formulas for plotting rainbow charts in WAVEWI$E.
 

A: Date @READ(c:\data\close\yourdata.txt)
B: Close
C: AVE1 @MAVG(CLOSE,2)
D: AVE2 @MAVG(AVE1,2)
E: AVE3 @MAVG(AVE2,2)
F: AVE4 @MAVG(AVE3,2)
G: AVE5 @MAVG(AVE4,2)
H: AVE6 @MAVG(AVE5,2)
I: AVE7 @MAVG(AVE6,2)
J: AVE8 @MAVG(AVE7,2)
K: AVE9 @MAVG(AVE8,2)
L: AVE10 @MAVG(AVE9,2)
M: URB 100*(@HIGH(B1..L1) - @LOW(B1..L1))/
(@MAX(CLOSE,11) - @MIN(CLOSE,11))
N: LRB - URB
O: RO 100*(CLOSE-@SUM(C1..L1)/10)/
(@MAX(CLOSE,11)- @MIN(CLOSE,11))

-- Peter Di Girolamo, Jerome Technology
908 369-7503, E-mail: jtiware@aol.com
Internet: https://members.aol.com/jtiware

GO BACK


Return to July Contents