NOVICE TRADER
The Head-and-Shoulders Formation
by Thomas Bulkowski
Have you ever lost money suffering through a head-and-shoulders reversal? Here's a primer on one of the better-known chart patterns that signal major bottoms and tops.
I was doing research in the public library when a staffer asked me if I could help an elderly lady find a chart of TWA [TWA]. The investment materials are sparse at the library and the periodicals that were available didn't have what she needed. The library does have an Internet connection, however, so we went surfing looking for a Web page to chart the stock. Within minutes, we had printed out what she was looking for.
Before the ink was dry, she asked me if I knew anything about charts. I told her I did, a little, at which she pointed to the printout and asked, "Is that a double top?" (Figure 1). That was when I looked at the chart and immediately noticed a head-and-shoulders formation. She was, she told me, considering either adding to her position or selling it completely: A typical investor quandary. Figure 1 shows how unlucky she was at having purchased her first lot in early 1996 and riding the head-and-shoulders reversal down. The stock recently changed hands at about $6.
CHARACTERISTICS
Sometimes it pays to follow more than one stock in an industry to help gauge its health. Research indicates that industry behavior accounts for 15% to 20% of a stock's price fluctuation. Other factors also influence the stock's price: The economy (30% to 35%), the company (30% to 35%) and other factors (15% to 20%).
Such was the case with Cirrus Logic Inc. [CRUS], seen in Figure 2. The chart shows two examples of a head-and-shoulders top. Along with Cirrus, Chips and Technologies [CHPS] and Vlsi Technology Inc. [VLSI] both had a head-and-shoulders formation appear during the last quarter of 1996. Charts of the three companies, when taken together, indicated growing weakness in the semiconductor industry. They served to warn the astute investor that the bottom was about to drop out of the high-tech sector.
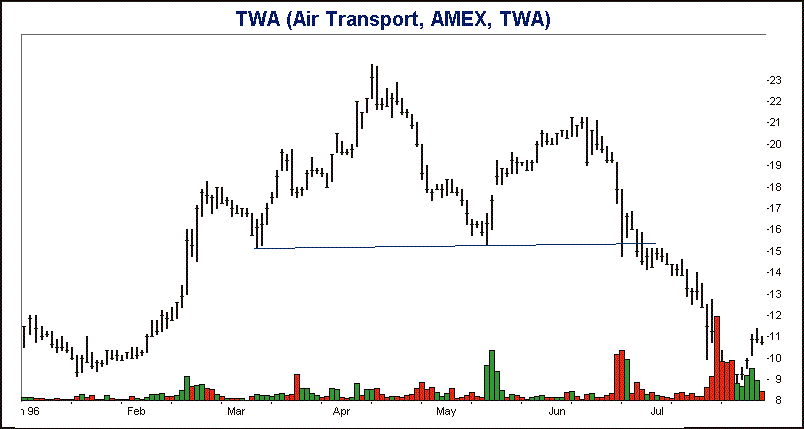 FIGURE 1: HEAD-AND-SHOULDERS IN TWA. The stock dropped from a high of 233/4 to 8-1/8 in just over three months. In the past year, it has bottomed at just over $5.

FIGURE 2: TWO HEAD-AND-SHOULDER TOP REVERSALS. The volume on the left shoulder is the highest, followed by the head and right shoulder, respectively. The neckline joins the two shoulder troughs.
Thomas Bulkowski uses his software engineering skills to further his investment activities. He can be reached at 210 Stallion Drive, Keller, TX 76248. For a response, include a self-addressed, stamped envelope.
Excerpted from an article originally published in the August 1997 issue of Technical Analysis of STOCKS &COMMODITIES magazine. © Copyright 1997, Technical Analysis, Inc. All rights reserved.