Despite the growth in mechanical systems trading over the past decade, classical chart pattern analysis continues to enjoy a wide following. For example, Robert Edwards and John Magee's Technical Analysis of Stock Trends, considered to be the bible of classical charting, remains one of the all-time best-sellers in the field of technical analysis. Last year's Dow Jones Telerate seminar in New Orleans featured no less than six speakers on the topic of classical chart patterns, including two institutional traders who run proprietary currency trading desks. And in 1995, the New York Reserve Bank undertook an investigation of the predictive powers of the venerable head-and-shoulders chart pattern. Their research found that the head-and-shoulders pattern yielded significant excess profits in select currency markets. Among their explanations for this phenomenon was that a sufficient number of traders who recognize the pattern invariably trade it, thus driving prices in the expected direction. And finally, over the past several years there has been a swell of interest and investigation into Wyckoff charting principles, as has been seen in Stocks & Commodities and various publications. Clearly, charting, the blue-collar approach to technical analysis, is alive and well.

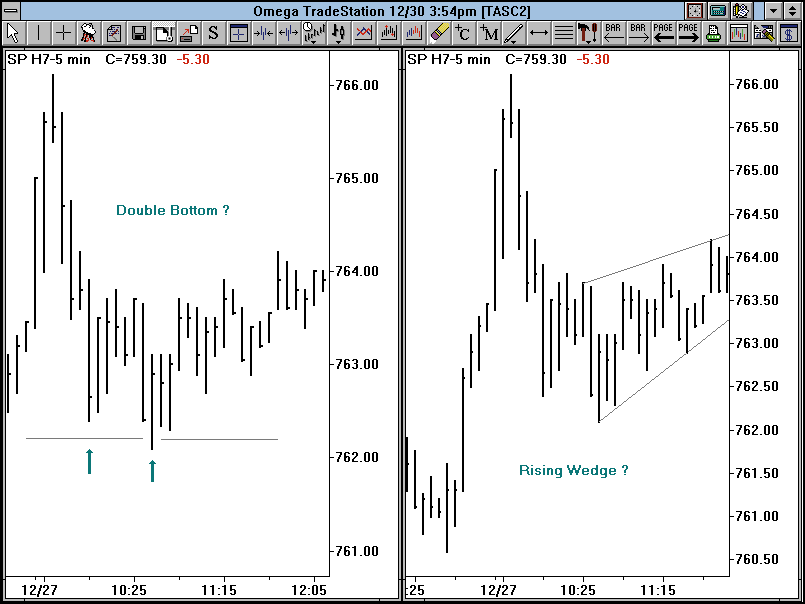
FIGURE 1: MARCH 1997 S&P FUTURES FIVE-MINUTE BARS. During the early morning, the market twice neared the 762.00 level and rallied. The two trendlines were forming a rising wedge. Should you be long because support held or short because a possible rising wedge is forming?
Another problem that arises with chart patterns is that most traditional definitions implicitly contain a directional bias. Once a bullish triangle has been identified, the chartist is conditioned to anticipate higher prices and may subconsciously exclude any additional evidence to the contrary. Fortunately, these criticisms can be dealt with by establishing a set of procedures that will reduce the subjective nature of chart analysis, as well as enable a technical trader to identify chart formations with the most trading potential.