The markets are not always efficient; this is why trading decisions based on technical analysis work. Chart patterns that are discernible, technical events such as double bottoms and Elliott waves, allow technically based traders to make intelligent decisions. Another key discernible event that techncal traders may make use of comes in the form of cycles. As a rule, it is not a task of much difficulty to identify cycles; a simple approach, such as measuring the distance between successive lows, can be used to measure them, or a more sophisticated approach using computer algorithms such as maximum entropy spectral analysis (Mesa) can be used.
However, the observation that cycles exist is not to imply that they exist at all times. Markets can be caught off-guard by events that can and have on occasion dominated and obscured present cycles. Research indicates that cycles useful for trading are present only about 15% to 30% of the time, corresponding with technician J.M. Hurst's comment that 23% of all price motion is oscillatory in nature and semi-predictable. The situation is comparable and indeed parallel to the problem that the trend-follower faces when he or she finds that the markets trend only a small percentage of the time.
DEFINING A CYCLE
A cycle is defined as an interval of time in which one round of events or phenomena that recur regularly and in the same sequence is completed. In the market, a cycle is considered to be a classic form when the price starts low, rises smoothly to a high, and then falls smoothly back to the original price over the same length of time. The time required to complete the cycle is called the period of the cycle or the cycle length.
Cycles exist in the market. In many ways, their existence is confirmed, if only on fundamental considerations. Surely one of the clearest indications of their existence are the seasonal changes that occur every year for agricultural prices (lowest at harvest) and the decline of real estate prices in the winter. Further, television analysts constantly refer to the rate of inflation being seasonally adjusted by the government. But seasonal changes are a specific case of the cycle, as they always occur in a 12-month period. Other examples of fundamentals-related cycles can originate from the 18-month cattle-breeding cycle or the monthly cold-storage report on pork bellies.
DRUNKAR"S WALK AND THE DIFFUSION EQUATION
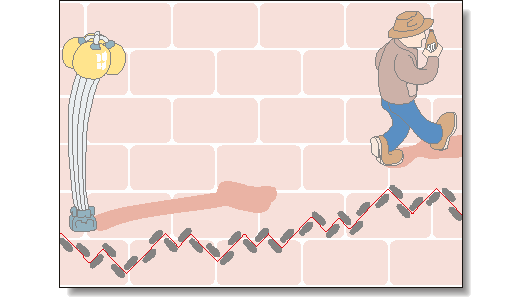
The drunkard's walk is formulated by allowing the theoretical inebriated person to step to either the right or left on a random basis with each step he or she takes forward. The decision to step right or left is made on the outcome of a coin toss from a balanced coin. If the coin turns up heads, the drunk steps to the right. If the coin turns up tails, the drunk steps to the left. When viewed from above, the random path that the drunk has followed becomes clear. Figure 1 shows a computer-generated path using the rules of the drunkard's walk. We can write a differential equation for this path because the rate change of time is related to the rate change of position in two dimensions. The result is a differential equation called the diffusion equation that describes many physical phenomena such as heat traveling up a silver spoon when it is placed in a cup of hot coffee or the shape of the plume of smoke as it leaves a smokestack. Picture this plume of smoke in a gentle breeze. The plume is roughly conical, widening the farther it goes away from the smokestack. The plume is bent in the direction of the breeze. The widening of the plume is, more or less, the description of the probability of the location of a single particle of smoke. Clearly, no cycles are involved. Figure 2 shows the overlay of 100 computer-generated random paths, and it is not much of a stretch to visualize the smoke plume.

Figure 1: the Drunkard's Walk Path. The drunkard's walk is formulated by allowing the theoretical inebriated person to step to either the right or left on a random basis with each step he or she takes forward. The decision to step right or left is made on the outcome of a coin toss from a balanced coin. If the coin turns up heads, the drunk steps to the right. If the coin turns up tails, the drunk steps to the left. When viewed from above, the random path that the drunk has followed becomes clear. Figure 1 shows a computer-generated path using the rules of the drunkard's walk.
