Here is this month's selection of Traders' Tips, contributed by various developers of technical analysis software to help readers more easily implement some of the strategies presented in this issue.
You can copy these formulas and programs for easy use in your spreadsheet or analysis software. Simply select the desired text by highlighting as you would in any word processing program, then use your standard key command for copy or choose "copy" from the browser menu. The copied text can then be pasted into any open spreadsheet or other software by selecting an insertion point and executing a paste command. By toggling back and forth between an application window and the open Web page, data can be transferred with ease.
This month's tips include formulas and programs for:
 TRADESTATION
TECHNIFILTER PLUS
SMARTRADER
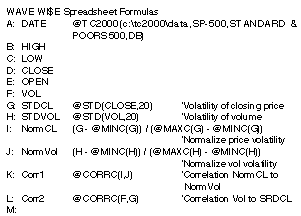
WAVEWI$E MARKET SPREADSHEET
or return to September Contents
Here are two indicators to assist readers in identifying some of the classic chart patterns, as discussed in Daniel Chesler's 'Identifying significant chart formations' elsewhere in this issue. Ideally, you will use one or both of the indicators in conjunction with other analytical techniques, such as trendlines, to identify trading opportunities on your charts.
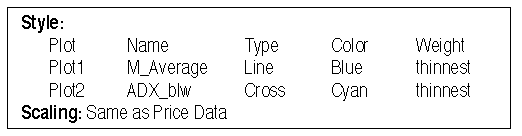
The first indicator, the Adx/MovAvg Combo, is a relatively simple indicator based on the average directional movement indicator (ADX) and moving average calculation. This indicator plots a 50-bar moving average and triggers both visual and audio alerts when a conspicuous decrease occurs in the ADX below a specified level, which in this case is 15. The indicator code to be entered in the TradeStation Power Editor follows. Suggestions for the format settings for this indicator are given after the code.
Type: Indicator
Name: ADX / MovAvg Combo
Inputs: Price(Close), AvgLen(50), ADXLen(14), Level(15); Vars: AvgVal(0);
AvgVal = Average(Price, AvgLen);
Plot1(AvgVal, "M_Average");
IF ADX(ADXLen) < Level Then Begin Plot2(AvgVal, ÒADX_blwÓ); IF CheckAlert Then Alert = True; End;
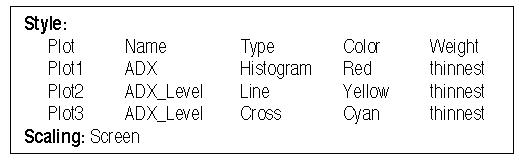
The second TradeStation indicator plots the ADX as a histogram, as in Chesler's article. A horizontal line, which defines a conspicuously low ADX value, is also plotted. This indicator allows you to see the performance of the ADX, as well as visually identify its proximity to the specified level. A visual and audio alert is triggered whenever the ADX is below that level. The indicator code to be entered in the TradeStation Power Editor follows. Suggestions for the format settings for this indicator are given after the code.
Type: Indicator
Name: ADX w/Level
Inputs: ADXLen(14), Level(15);
Plot1(ADX(ADXLen), "ADX");
IF Plot1 > Level Then
Plot2(Level, "ADX_Level")
Else Begin Plot3(Level, "ADX_Level");
IF CheckAlert Then Alert = True;
End;
Gaston Sanchez with Francis A. Rivera, Omega Research 800 422-8587, 305 270-1095,Internet: https://www.omegaresearch.com
GO BACK
In "Identifying significant chart formations," Daniel Chesler uses some basic technical indicators to decide whether a particular chart pattern is significant. Here's a TechniFilter Plus 8.0 report that screens your database for trading opportunities using two of the technical indicators that Chesler discusses, the 50-day average and the ADX indicator.
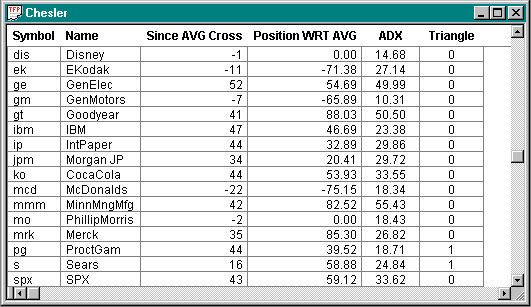
Formulas 3 and 4 give information about the relationship between the close and the 50-day average. The "Since Avg cross" column gives the number of days since the last cross of the close and the 50-day average. A negative number indicates that the close is below the average, and a positive value indicates the close is above the average. For example, on EKodak, the close crossed below the average 11 days ago, and on GenElec, the close crossed above the average 52 days ago.
The "Position Wrt Avg" column quantifies as a percentage how far away the close is from the average with respect to the maximum distance between the close and average since the last cross. Again, the sign of the number indicates whether the close is above or below the average. For example, a reading of 100 (or -100) indicates that the close is as far away from the average as it has been since the cross. The 54.69 on GenElec means that the close is about half the maximum distance that it has been away from the average.
Formulas 3 and 4 provide a good analytical snapshot of how the 50-day average and the close are related. To spot changes of trend in this information, you look for issues with closes that are approaching the average (for example, if column 4 were getting smaller in magnitude). Column 3 tells you how long the current trend has been in effect. The larger this number in magnitude, the longer the trend.
Formula 5 is the ADX formula from the TechniFilter Plus library. Chesler looks for ADX values less than 15 to signal that significant patterns are under formation. The last formula, on the triangle, compares the last two peaks and last two valleys on the 5% zigzag of the highs and lows to see if a triangle is forming. If one is forming, you can check the ADX and 50-day average statistics to see if this formation is shaping up to be something significant.
FORMULAS
[1] Symbol
[2] Name
[3] Since AVG Cross
(C > CA50)U7 - (C < CA50)U7
[4] Position WRT AVG
([3] U0 > 4) * 100 * (C-CA50) /
( ((CU13Y000-CU13)<([3]U0Y000)) * (C-CA50)U0)M0
[5] ADX dm_adx(14,27)
[6] Triangle
(HZ5U31 < HZ5U32) * (LZ5U21 > LZ5U22)
This TechniFilter Plus strategy and the reports, strategies and formulas of earlier Traders' Tips can be downloaded from RTR's Web site.
--Clay Burch, RTRSoftware, 919510-0608, E-mail: rtrsoft@aol.com Internet: https://www.rtrsoftware.com
GO BACK
Identifying the chart formations described in this issue's "Identifying significant chart formations" always requires a certain element of visual interpretation, something that's nearly impossible to accomplish with a purely mechanical system. The SmarTrader SpecSheet in Figure 2 implements the mechanical components of the technique, which are a 50-day moving average and the average directional movement indicator (ADX).
Row 9 is the 50-period simple moving average of the close. Since ADX is the result of several interim calculations, rows 10 and 11 calculate Diplus and Diminus. They in turn are used in row 12 to develop DX. Finally, in row 13 the ADX is calculated based on DX.
Row 14 defines the buy rule as a close above the moving average and an ADX greater than 15, which indicates a trend. Row 15 defines the sell rule as a close below the moving average and ADX greater than 15, which indicates a trend.
Using approximately three years of continuous contract data for the Treasury bond, this system returned a respectable 18 1/2-point gain in that period.
This system can also be implemented in CompuTrac SNAP.
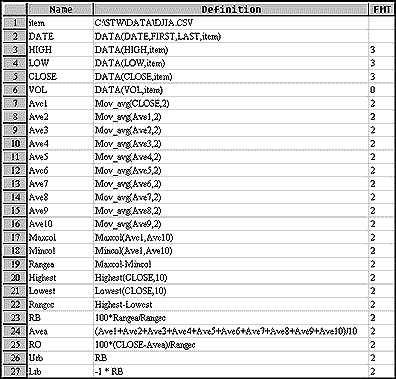
FIGURE 2: SMARTRADER. Here's a SmarTrader SpecSheet that implements a 50-day moving average and the average directional movement indicator (ADX).
This SmarTrader SpecSheet file is available from Stratagem Software's Web site.
--Jim Ritter, Stratagem Software International ,504 885-7353, E-mail: Stratagem1@aol.com ,Internet: https://www.stratagem1.com.
GO BACK