NEW TECHNIQUES
Three-Line Break Reversal Signals
This charting technique is a simple but effective technique for determining the direction of the trend as well as changes in the trend.
With volatility in the stock market increasing, many new and elaborate methods have been developed to predict market turns. This poses a problem: Indicators of complex construction may work or they may not, for no apparent reason. So finding system components that follow the keep-it-simple approach may seem unfashionable, but in reality it is a survival technique. In fact, older and simpler indicators have withstood the test of time for good reason. One classic technique is the point and figure charting method, which is used by many professionals to identify and gauge market reversals. Recently, analyst Thomas Dorsey published an excellent expansion of the classic de Villiers work on this charting method. Using point and figure charts, though, requires time, specialized skill and, in some cases, data that may be inaccessible to nonprofessionals. Fortunately, there's an old, simple and underused approach to predicting reversals, a method similar to one aspect of point and figure. This technique is known as three-line break charting. Three-line break charts, also known as three-step new price and three-step reversal charts (or variants of these names using different numbers), were developed in Japan in the 19th century. Today, they are in widespread use in the Far East but little known as yet in the West. Recently, these techniques have been featured in Steve Nison's Beyond Candlesticks, and routines for their construction are now included in major analysis software packages as part of candlestick modules. Three-line break charts incorporate properties of point and figure charts along with those of a standard line or bar chart. The method is suitable for trading vehicles where high-low-close or intraday data is not available, such as mutual fund data, as the technique only requires a single price for each period charted.
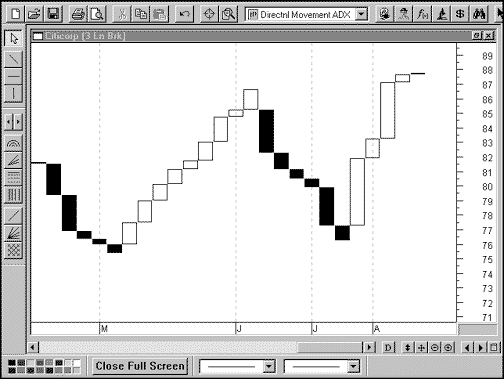
 FIGURE 2: CITICORP THREE-LINE BREAK. The consolidation periods seen in Figure 1 are filtered out, and now the trend is clear.
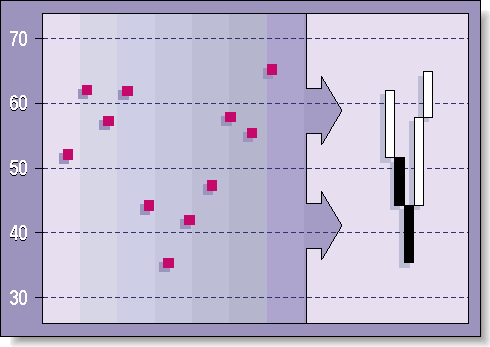
 FIGURE 3: THREE-LINE BREAK -- USING CLOSING PRICES. Using closing prices to establish the basis chart, the downward closes are black and the upward closes are white. A new line is drawn only if the last line is exceeded.
For this study, I charted a few dozen futures series. While lumbar, coffe and the Nikkei contracts produced the best signals, in virtually all the markets I examined, the reversal charts provided sound confirmation of trends.
William Arnold was a senior scientist with the federal government and now works on developing trading tools that utilize alternative charting methods. He is also president-elect of the Association of Official Analytical Chemists International. He can be reached at 510 938-7280 or via E-mail: wtarnold@dnai.com/. He thanks Jurik Research and Consulting, https://www.jurikres.com, for technical assistance.
Excerpted from an article originally published in the October 1997 issue of Technical Analysis of STOCKS & COMMODITIES magazine. All rights reserved.
© Copyright 1997, Technical Analysis, Inc.
Return to October Contents


