When a market breaks out of a technical trading pattern, traders need to correctly gauge potential price moves against the risk of being wrong. Most patterns reveal the market's intentions in their own shapes and sizes. Two, and sometimes three, price targets can be forecast with a simple assessment of the pattern itself. Measuring potential price moves works for all patterns and all time frames, thus aiding traders in their pursuit of profit.
But first, we need to review the basics of support and resistance. Simply stated, support and resistance are price levels at which prices stop going down or up, respectively. A price in any market is one that buyers and sellers have agreed is fair value. If more buyers think that price is fair, they will attempt to buy. This, in turn, raises demand, and so prices rise. As prices rise, buyers become less active while sellers become more active. At some point, buyer and seller activity will balance, and this price level becomes resistance. The more times a market touches a level of resistance (or support), the more significant that level will become because buyers and sellers do not perceive fair value to be any higher (or lower) than that level. The market will have difficulty in rising (or falling) any further unless something occurs that causes perceived fair value to change.
Let's use an example in the stock market. Resistance for the stock of XYZ company is at $50. The market bounces around below $50 for several weeks until the company announces better than expected earnings. Now, both buyers and sellers think that fair value is higher than $50. The market breaks out of its trading range and trades higher until buyers and sellers agree that fair value is $55.
Something interesting happens at that point. If the market trades back down to $50, buyers who missed the earlier breakout will see their second chance to go long. Most market participants would call this a test of the breakout. The market bounces up off the $50 level, which has now become support. If the market makes it back up to the $55 level, sellers who missed their chance to unload their stock at the higher price earlier will become active at that point. This increased supply resists the market's attempt to move higher, so prices once again fall back.
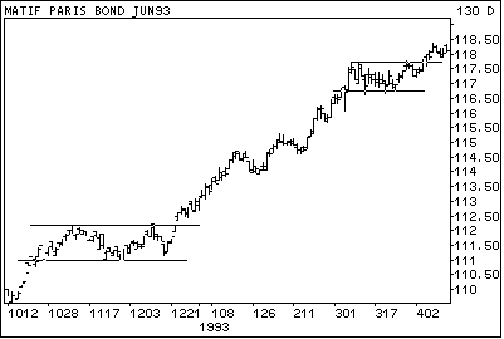
The chart of MATIF French bond futures (Figure 1) illustrates this activity. The two highlighted areas show how the market traded lower off resistance levels. Later, it failed to break through on its second attempt as sellers who missed the first opportunity took advantage of the second.

FIGURE 1: JUNE 1993 MATIF FRENCH BOND. The horizontal lines represent support or resistance levels. At support, expect buyers to enter and support the market. At resistance, sellers are strong enough to keep the market from rallying. Breakouts often indicate a new trend is under way.