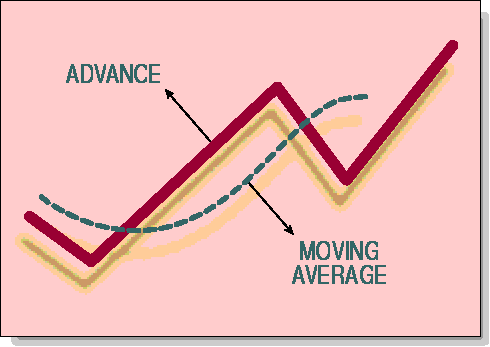
After a market advance and the price drops below its moving average, technicians are faced with a question: Is the decline just a correction, or is it the beginning of a trend reversal? If, after the moving average cross, the technician decides it is indeed a correction (Figure 1), he'll prepare to buy support, anticipating a resumption of the trend. If, on the other hand, he decides it is the start of a reversal, he will short the market when it crosses the average, anticipating even lower prices.
After an advance and the market crosses below the moving average, how can you determine if a trend correction or a trend reversal is occurring? If the advance were a strong one, we should assume that the cross of the moving average signals the start of a correction, or at least a temporary pause in the uptrend. If the advance were weak, we would assume that the moving average cross signals the trend had ended and a reversal was under way.
To gauge the strength of an advance or decline in the Treasury bond market, let us examine two properties of that market move -- its average trading volume and growth of open interest. Before I discuss this, however, let's review the logic behind volume and open interest analysis.
When new or compelling information is introduced to a group of people, they take action, and the level or volume of activity rises thereafter. Here's an example. If your phone rang and it was the lottery commission awarding you and those in the room with you a million dollars each, what would happen next? Activity in the room would skyrocket. You would jump up and shout the news to those around you. After your coworkers heard the news, they would jump up and down frantically, rejoicing in their good fortune. On the other hand, if your phone remained silent and no new information were introduced, activity in the room would remain low.
Similarly, when a fundamental force exerts itself on the market, the news media reports it. When this information reaches the eyes and ears of market participants, the market participants make trading decisions. The volume of market activity increases as those participants buy and sell. When trading volume rises, you can deduce that new and compelling information is being discounted by the market. The higher the trading volume, the stronger the fundamental force, and so it is likely the force will reexert itself at a later time.
