by John Sweeney


The on-balance volume indicator is a technical tool that traders use to determine the trend of volume. Here are the basics.
The interplay of price and volume is the combination that is most discussed in traditional technical analysis. In these discussions, volume either confirms or does not confirm price movement by its expansion or contraction from prevailing values. Analysts examine the wildly fluctuating bar charts usually shown below price graphs to determine whether volume is truly expanding or contracting.To smooth the fluctuations in volume and also provide an overall indicator of price direction, trader Joseph Granville proposed in 1976 that volume should simply be summed each day according to whether the price went up or down. If the price went up from close to close, the day's volume would be added to the running total. If price went down, on the other hand, the day's volume would be subtracted from the running total.
This simple idea turned out to have surprising utility, especially in the stock markets. Though Colby and Meyers, not to mention numerous other analysts, put on-balance volume (OBV) through additional summations, smoothings and measures of momenta without finding any advantage over simple moving averages, the most advantageous use was simply its reaching new highs or new lows. Moreover, its treading new ground was seen most easily on a chart.
Before diving into the visuals, however, think through where OBVis most likely to be valuable. Since it's predicated on volume, you need a tradable with material volume. Surely, volume spikes in lightly traded issues stand out sharply, but what OBV trades on is the law of large numbers: large numbers of trades of large numbers of shares. In these huge numbers, individual factors are washed out. Plus, the summing process amasses data from many, many days, minimizing the impact of any one day.

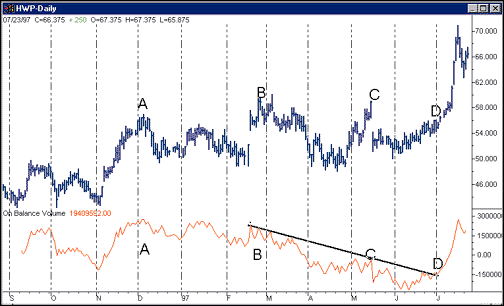
FIGURE 1: HEWLETT-PACKARD. Checking Figure 1, we can see how the cumulative nature of OBV helps. Hewlett-Packard in 1997 experienced one of its few doldrums. Looking for new highs during a period of rapid market acceleration, HP gave several hints at points B and C, but neither found new higher ground. In fact, OBV sagged steadily as HP waffled in the $50-58 range. Not until point D did HP's OBV clearly change its trend, seven trading days before a large break upward. OBV validated HP's waffling: Volume was heavier on the down days, depressing OBVand telling us the upside did not have big money.
Obv is such a standard these days that nearly every analytical package supplies it as a standard or default indicator. Joe Granville's idea (or popularization of an older idea -- the origin isn't clear) has become one of the most reliable of trading and investing indicators.