THEORY 

Cycle Measurements

The author of Mesa and Trading Cycles and developer of the MESA software series presents why you should dynamically adjust your indicators due to the change in market cycles. 
There's no doubt about it: Market cycles can be difficult to identify. But if they can be measured, the payoff can be substantial. By measuring cycles, we have an independent parameter that frees us from using static indicators such as stochastics, the relative strength indicator (RSI), moving average convergence/divergence (MACD) or even moving averages with fixed settings. Measuring cycles enable us to dynamically adjust these indicators to current market conditions.

Currently, there are three popular methods to identify market cycles, and these are cycle finders, Fourier transforms? and maximum entropy spectral analysis? (MESA). Cycle finders, which are included in virtually all indicator toolbox software programs, basically measure the spacing between successive lowest lows (or other identifiable places in the cycle) and in general depend on finding an average value across a number of cycles.

Fourier transforms have long been a tool for scientific analysis but suffer from resolution problems in an attempt to satisfy stationarity constraints. Market cycles aren't long enough to make a good Fourier transform measurement. We'll go into more detail in a moment on this issue. We have adapted the MESA approach for market analysis from seismic exploration for oil, when obtaining information from a short burst of data is mandatory.
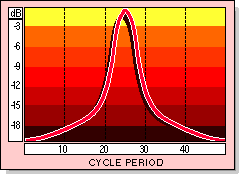
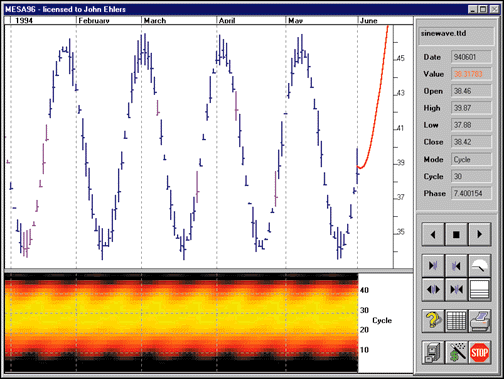
FIGURE 1: SPECTRUM AMPLITUDE VS. CYCLE PERIOD.
A spectrum display often consists of a plot of the amplitude of the cyclic components versus the frequency or cycle period. Such a display is shown in Figure 1. This display shows amplitude on a logarithmic decibel scale to capture as wide a range as possible.
FIGURE 2: FOURIER TRANSFORM RESOLUTION OF A 24-BAR CYCLE.
The colors can be used to demonstrate the spectral estimate below a bar chart as a colorized contour plot, thus picturing the spectral estimate in sync with the price action. Doing this, both a theoretical 24-bar cycle and its Fourier transform can be seen.

Entropy is a measure of disorder. The MESA technique extracts cyclic information from a dataset, leaving the residual with a maximized noise, or disorder.


John Ehlers, Box 1801, Goleta, CA 93116, 805 969-6478, is an electrical engineer working in electronic research and development and has been a private trader since 1978. He is a pioneer in introducing maximum entropy spectrum analysis to technical trading through his MESA computer program.
Excerpted from an article originally published in the November 1997 issue of Technical Analysis of STOCKS & COMMODITIES magazine. All rights reserved.
© Copyright 1997, Technical Analysis, Inc.

Return to November Contents