Do any of these samples of sage advice sound familiar? "Don't buy it here, but wait for a pullback." "I would wait and sell on a bounce." What does this really mean? Where and when do you act? Here's one technique for calculating retracement levels using that tried-and-true favorite, Fibonacci ratios, as well as using momentum to define the trend.
Markets trend in a zigzag manner: rallying, leveling off, and surging again, only to be hit by a wave of profit-taking before settling into a trading range, awaiting the next reason to advance or retreat. This activity carries on in the general direction of the trend, easily seen on a price chart. Technically, the trend should be considered up as long as the market unfolds with a series of higher lows and higher highs. Similarly, the trend is considered down if the price action is a series of lower lows, with lower highs before each new low. A market is considered not to be in a trend if the price movement manifests itself in a series of fits and starts or if it fails to sustain levels beyond the previous extreme points, often reversing and forming the range.
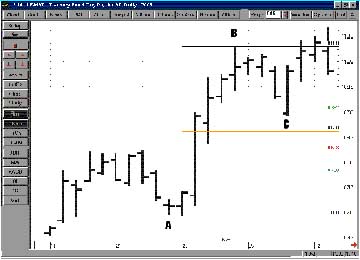
During an uptrend, good traders will buy the pullbacks, positioning themselves with the trend, taking advantage of the market's tendency to ebb and flow. When the market is in a downtrend, however, the strategy is to sell rallies, awaiting for the downtrend to resume.
So what is the appropriate strategy to calculate price levels for buying pullbacks or selling rallies? One popular technique is to calculate and project a percentage retracement of the prior swing and use that as an entry level. But what percentage retracement is suitable? One popular set of retracement levels is based on a mathematical series discovered by an Italian mathematician more than 700 years ago.
SON OF BONACCI
Fibonacci ratios, which are used by traders, is based on the work of the 13th-century Italian mathematician Leonardo of Pisa, better known by his nickname, Fibonacci (an abbreviation of filius Bonacci; filius is Latin for "son of"). Fibonacci, through the process of solving a mathematical riddle, discovered a unique mathematical sequence or series wherein the ratio of any two consecutive numbers approximates 1.618 or its inverse, 0.618. The Fibonacci sequence is the sum of any two adjacent numbers that forms the next number in the series. The first 14 terms in the sequence are 1, 1, 2, 3, 5, 8, 13, 21, 34, 55, 89, 144, 233, 377. The ratios of each two consecutive numbers from the series are 1, 0.50, 0.666, 0.60, 0.625, 0.615, 0.619, 0.618, 0.618..., and between alternate numbers, the ratio is 2.618 and its inverse, 0.382. The Fibonacci ratio is also referred to as the Golden Ratio or the Golden Mean.