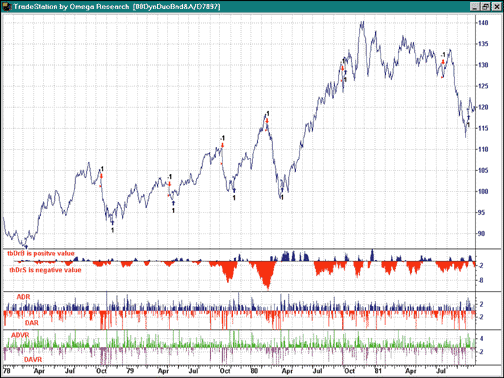
According to many market pundits, buy and hold is the best way for an individual to create wealth from the stock market. If you were to review the history of the stock market, however, you would see that the buy-and-hold approach requires considerable intestinal fortitude, as bear markets are not an easy thing to live through. One approach is to use a market timing model in hopes of forgoing the challenge of coping with bear markets and yet participate in the bull markets. The model would signal when to be invested and when to move to the sidelines. Toward that end, the model should be developed with specific rules as well as show a mathematical historical advantage to capturing a reasonable portion of a bull market but keeping risk at a tolerable level. In this article I explain one market timing model, as well as the steps I undertook in its development.
In the March 1997 STOCKS & COMMODITIES, I presented a stock market timing system that uses as its base for generating signals the relative strength of the Dow Jones utilities to the Standard & Poor's 500 and the number of consecutive days that the Dow Jones Utility Average (DJUA) was up or down from its value some lookback period x days ago. The utility model recently issued an untimely S&P 500 sell signal on May 30, 1997, at 848. As of August 1, the S&P 500 stood at 947. This sell signal represents a drawdown loss of 11.7% thus far.
While this drawdown loss in this huge bull market is disconcerting, it is not unusual for this model. In 1987, the model issued a sell signal on June 22, 6.76% below and two months before the final top on August 25, 1987. On June 24, 1981, the model issued a buy signal and suffered a 29% drawdown before the final bottom was made nearly 14 months later on August 12, 1982. It is fair to say that first, when a model has had big drawdowns in the past, big drawdowns can also be expected in the future, and second, the utility model depends on only one data series, namely, the Dow Jones utilities. The relationship between the utilities and the S&P 500 can easily go askew for a period. When this happens, poor buy and sell signals occur.
To solve this problem, I combined the utility model with the turbo advance/decline, new-high, new-low market system presented in the August 1997 issue. I also wanted to eliminate the new highs and new lows as variables with this new, combined model so I could test the model further back than 1978. The 52-week new-high and new-low indices have been published only since January 3, 1978. Before then, the new-high and new-low data was based on a variable lookback period of three to 14 months.
