THE NOVICE TRADER
The Stochastic Oscillator
by Joe Luisi
The stochastic oscillator is one of the more popular indicators available on today's software. This technical tool tells you where the current closing price is relative to the recent range of the market. Here are some techniques for using this classic indicator.
First introduced by George Lane in the 1970s, the stochastic indicator has become one of the more popular technical indicators around. Pages upon pages have been devoted to explaining the indicator and how it works. Further, just about every technical analysis software product available today offers this indicator.
The stochastic oscillator was designed to indicate when a market becomes overbought or oversold within a trading range. The indicator produces readings between zero and 100. As initially proposed, readings over 70 indicate an overbought market. The term overbought describes a situation in which the market has run up quickly due to an influx of buyers. Eventually, the market reaches a price level high enough that traders feel uncomfortable buying. Then, as sellers enter the market to take profits, prices start to fall.
That decline may be short-lived, and an upward trend might resume, or the recent peak might represent a top and much lower prices might be ahead. In that case, a move below 30 indicates an oversold situation. The expectations of a rally after reaching oversold levels are based on the same circumstances as the overbought, except the conditions are reversed; it is a situation in which the market falls precipitously due to an influx of sellers. All of this is viewed as the normal ebb and flow of the market as it moves from one extreme to another.
This type of market action is well-suited for an oscillating indicator, giving guidance when the market reaches these extremes. For example, in Figure 1 a five-day stochastic indicator can be seen for the US Treasury bond futures from October 1996 through February 1997. The market peaks and bottoms are coincident with readings of above the 70 to 80 level for the market tops and below the 20 to 30 level for the bottoms.
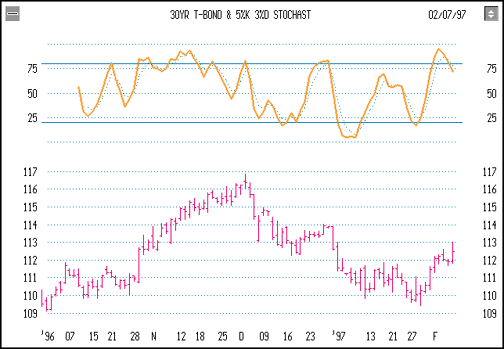
FIGURE 1: US TREASURY BONDS, 10/96-2/97. A five-day stochastic indicator can be seen here. The market peaks and bottoms are coincident with readings of above the 70 to 80 level for the market tops and below the 20 to 30 level for the bottoms.
Joe Luisi can be reached at 717 558-6407. He specializes in consultation and system development for the futures markets and has foreign exchange historical data.
Excerpted from an article originally published in the December 1997 issue of Technical Analysis of STOCKS & COMMODITIES magazine. All rights reserved.
© Copyright 1997, Technical Analysis, Inc.
Return to December Contents

