NOVICE TRADER
Double Tops
by Thomas Bulkowski
It takes more than twin peaks to make a double top. Here's a refresher on the formation.
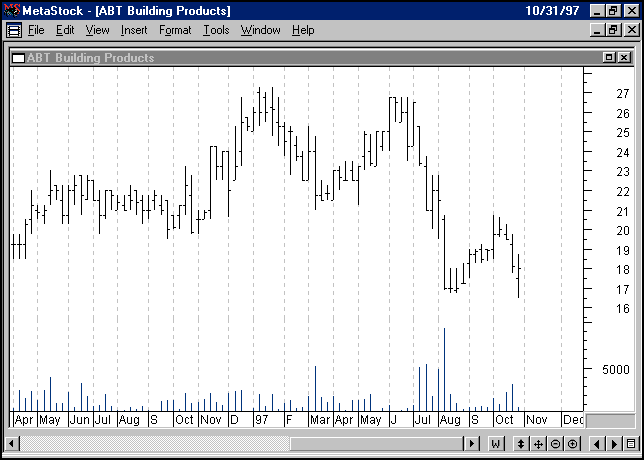
The twin peaks are the first thing you'll notice in a double top. The classic definition as suggested by Robert Edwards and John Magee in Technical Analysis of Stock & Commodities a double top. But there's more to double tops than simple identification, and in my study of the formation and creating subroutines to recognize them, the selection criteria came into sharp focus. A good example of a double top is shown in Figure 1 and distinguishing characteristics are outlined in Figure 2.
As an example, however, in Figure 1 the weekly volume at the top in late January peaked at 103,700 shares, sharply above the 65-day moving average of 34,200. In contrast, volume during the week when the second peak occurred was only 28,300 shares.
FIGURE 1: A RECENT DOUBLE TOP ON A WEEKLY SCALE. The twin peaks are the distinguishing characteristic along with a rounded trough between and, most important, prices that decline below the trough.Both the classic definition and the model I developed for automated computer testing ki uses his software engineering skills to further his full-time investment activities.
A double top is confirmed when prices decline below the lowest low between the two peaks.
Thomas Bulkowski uses his software engineering skills to further his full-time investment activities.Excerpted from an article originally published in the January 1998 issue of Technical Analysis of STOCKS & COMMODITIES magazine. All rights reserved. © Copyright 1997, Technical Analysis, Inc.