TRADING TECHNIQUES
by Gerald Marisch
In areas of equity and commodity price analysis, it is accepted that prices can move in only three directions -- up, down or sideways. These directions are called trends. In the simplest of charting techniques, trends can be evaluated by the location of closing prices in relationship to a trend's moving average -- whatever value the trader chooses to assign to the moving average lookback period. Uptrends are identified when the moving average is moving up and closing prices are above the moving average. Downtrends are identified when the moving average is moving down and closes are below the moving average.
But sideways trends are more difficult to define. Prices tend to move horizontally or in slightly up or down directions, while the moving average snakes around the closing prices. Whipsaws? are commonplace. Traders would love to know when prices enter these channels and break out of these channels, and what to do when prices are in these channels. Here's a simple yet effective technique that may offer a clue.
VIDYA
In the October 1995 issue of STOCKS & COMMODITIES, an article by Tushar S. Chande described the indicator he developed, a variable-length moving average (VIDYA, short for variable index dynamic average) that may be more responsive to market price movements than a conventional simple or exponential moving average and can in addition be used for position trading.
VIDYA results from a momentum oscillator that calculates a ratio by summing x number of up periods and down periods. The absolute value of the ratio is used as an index for adjusting the smoothing factor of y periods of an exponential moving average (EMA). As presented in Chande's article, VIDYA uses nine for the lookback period for the momentum oscillator (length) and 12 for the smoothing factor (smooth) of those periods (see sidebars, "Variable-length moving average" and "TradeStation code").
By its mathematical configuration, any moving average will be behind current prices. How much behind depends on how this same mathematical configuration is qualified to respond and relate to current prices. VIDYA is designed to adjust to market conditions. A market with a great deal of directional momentum will cause VIDYA to lag the price action, and when there is a sudden loss in momentum, VIDYA will shorten the lag distance to the current price action.
For instance, a 55-period simple moving average will define price activity within a trend with less specificity than a 55-period (length) VIDYA that considers only the last 21 closing prices (smooth). Even this 55-period VIDYA will be lagging farther behind current prices when compared with a 13-period (length) VIDYA that considers the last eight closing prices (smooth).
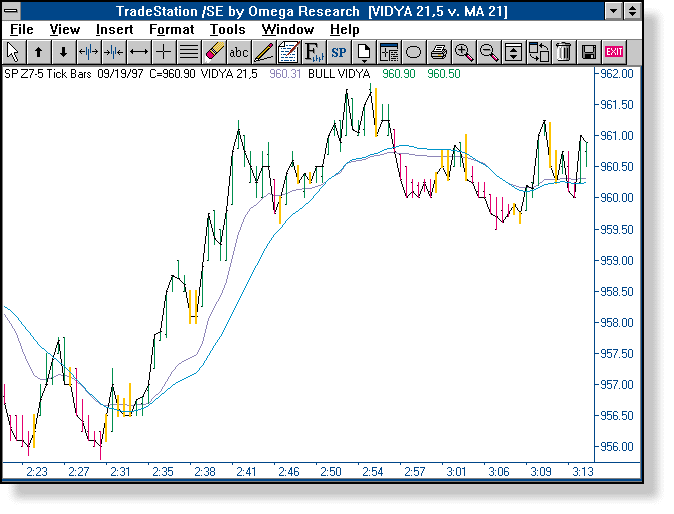
For day trading the Standard & Poor's 500 on five- and eight-tick charts, the length and smooth of one of the two VIDYA indicators used has been modified from Chande's suggested values to 21 for the length and 5 for the smooth.

Figure 1: December S&P 500. Compare the VIDYA 21,5 moving average (magenta line) with the simple 21-period moving average (dark blue line). The VIDYA 21,5 is more sensitive to current price movements than a conventional moving average. The simple 21-period moving average tracks price movements at a wide distance away from closing prices and changes direction at a much more casual angle when prices change direction.
Gerald Marisch is a private trader and can be E-mailed at https://www.Gpmtrader@Aol.com.
Excerpted from an article originally published in the January 1998 issue of Technical Analysis of STOCKS & COMMODITIES magazine. All rights reserved. © Copyright 1997, Technical Analysis, Inc.
Return to January Contents