NEW TECHNIQUES

by Rick Martinelli
Pattern recognition is a term that has been used to describe a variety of different, but related, phenomena. The ability of a camera and a computer to discern a particular image in a visually noisy environment is a classic example. For traders, pattern recognition has been used to study chart formations. Our interest here is with patterns that appear in market data charts and that often precede other patterns of interest, such as a sustained upward trend in price.
PATTERN SETUPS
Market traders with large stock portfolios are forced to search each of their charts for patterns that are in the middle of setting up. Several commercial financial software packages offer a pattern recognition feature whereby a chart can be searched for a prescribed pattern. In these, patterns are specified in such a way that a particular segment is judged as either having the prescribed pattern or not. The software might search for segments having two down days (that is, lower closing prices than previous days) followed by three up days. This approach may work for simple patterns, but not necessarily for complex ones.
In contrast, the correlation coefficient for time series allows a pattern to be specified as another chart segment of any length, provided it is shorter than the chart data being analyzed, and it also provides a statistically rigorous measure of the degree to which this segment resembles any other segment of the same length. Using this method, data may be scanned for a particular pattern and the results displayed as a chart of correlation versus time.
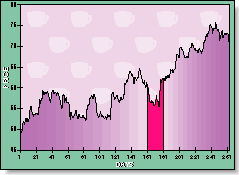
One pattern that can be used with the correlation coefficient method and precedes an uptrend is the cup-and-handle formation? described by author and Investors Business Daily founder William OÕNeil. OÕNeil claims that this pattern often reveals itself in a time segment that just precedes a sustained rise in daily closing prices for many stocks. In Figure 1, note that a 21-day cup-and-handle pattern has been clipped from a one-year segment of IBM stock data, where it preceded a price uptrend.
Another pattern thought to precede an uptrend is a computer-generated function that resembles a cup with an added handle formation. In this pattern, the original IBM data is scanned with both patterns to produce correlation charts, and in these, the charts appear to be similar. This is not unexpected, since the correlation coefficient is a robust statistic; small variations in the test pattern will not appreciably affect the outcome. These results show that standard, preformed test patterns may be used instead of actual chart segments to scan charts for patterns.
THE CORRELATION COEFFICIENT
The correlation coefficient is a statistic that is used to measure goodness-of-fit in many curve-fitting procedures, such as least-squares?. We use it as an indicator of fit between a user-selected chart pattern and all segments of another chart having the same length. (See sidebar, ÒTime series.Ó) Values of the correlation coefficient range between 1.0 and -1.0; a value of 1 indicates a perfect match, while a value of -1 indicates that an exact match had been found -- but the match is upside down. Values near zero, in contrast, mean there is no match at all. Values of 0.8 or more correspond to data patterns that are easily discerned as good matches using the human eye.
FIGURE 1: IBM DAILY CLOSING PRICES FOR 264 TRADING DAYS. The segment enclosed in vertical lines is an example of a cup-and-handle pattern.
Rick Martinelli is president of Haiku Laboratories, which supplies customized technical and scientific software to individuals and small businesses. He is an applied mathematician with a masterÕs degree in mathematics from San Jose State University. He has more than 20 yearsÕ experience in research and development in both private and military sectors. He may be reached via E-mail at haikulab@maui.net.
