STATISTICS
by Mike DeAmicis-Roberts
When traders analyze the results of their systems, they frequently look to the percentage of winners as proof of the systemÕs reliability. In many cases, this is a good indication. However, looking at the percentage of winners and losers only tells part of the story. Sometimes winning trades come in streaks. The trader who learns to exploit these streaks can maximize a systemÕs profitability.
When a trader views the percentage of winners, he assumes that all the trades in a sample happened independently of each other -- that is, the outcome of one trade did not affect the outcome of other trades. A good example of such an independent relationship between examples would be a coin toss. If you flip a coin, there is a 50% chance you will get heads, regardless of the result of the last coin toss. For independent situations, however, past events do not affect the probability of current events.
The markets may show dependence between trades. Here, the outcomes of the trades affect each other. It is a common observation among traders that most systems have winning and losing periods. In these systems, the trades may have a dependent relationship; a system that has lost on a long trade may tend to win in the next.
VARYING PROBABILITIES
Most card games are popular analogies for this kind of situation. Once a card is played and is not returned to the deck, it affects the probability of the other cards to be played. However, the next card to be played is a random occurrence, with probabilities different from those of cards played earlier. In this sense, the play of a deck is random and dependent on past events. This type of situation may apply to trading, where past events affect the future. If the market has broken below or above certain resistance levels, it may be reasonable to expect it to continue to the next resistance level.
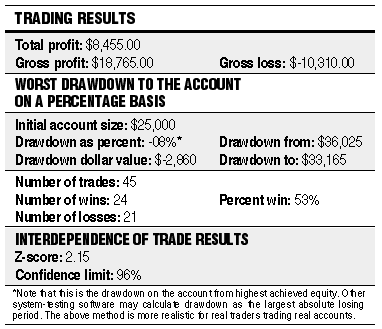
Wins and losses may come in streaks. Conversely, a trader may find that he or she usually loses after a win. The Z-score (see sidebar, ÒCalculating the Z-scoreÓ) is a mathematical tool that helps a trader analyze the dependence between trades. The Z-score tells the trader the tendency for a system to win or lose in streaks. Streaks are defined by the times a system shifts between losing or winning trades. For example, a system with a track record of ÒWin/win/loss/lossÓ has two streaks in it, one winning and one losing. A system with a track record of ÒWin/loss/win/lossÓ has four streaks in it.
The Z-score is calculated by comparing the number of streaks there are in a set of trades with the number of streaks that could be expected randomly. Then, this number is usually transformed into another value called the confidence level, using a table typically found in statistics texts. The confidence level gives a trader a good idea of the extent of the relationship between wins and losses.

Mike DeAmicis-Roberts is an independent developer of software for the study of money management. E-mail mike@moneysoftware.com for details.
Excerpted from an article originally published in the January 1998 issue of Technical Analysis of STOCKS & COMMODITIES magazine. All rights reserved. © Copyright 1997, Technical Analysis, Inc.
Return to January Contents