INDICATORS
by Tim Tillson
After studying his first stock chart, the novice technician is most likely to learn next about moving averages. This is a reasonable progression. First, moving averages are easy to understand. The simple moving average is just the average of a given number, which we will refer to as n, of previous closing prices, recalculated each day at the close. And second, technicians use moving averages because the moving average offers a smoother visual image of the market trend. In effect, the moving average removes the noise around the trend.
This concept of eliminating noise from the trend is similar to what engineers strive for in their application of digital filters. As R.W. Hamming observed:
Digital filtering includes the process of smoothing, predicting, differentiating, integrating, separation of signals, and removal of noise from a signal. Thus many people who do such things are actually using digital filters without realizing that they are; being unacquainted with the theory, they neither understand what they have done nor the possibilities of what they might have done.
This quote applies to the vast majority of indicators in technical analysis. Moving averages, be they simple, weighted, or exponential, are low-pass filters; low-frequency components in the signal pass through with little attenuation or reduction, while high frequencies are severely reduced. Oscillator-type indicators, such as moving average convergence/divergence (MACD), momentum and relative strength index, are another type of digital filter referred to as a differentiator.
Early in the steps of calculating any of these indicators, the difference between todayÕs price and some price a number of days ago or the difference between two moving averages are measured -- hence the term. STOCKS & COMMODITIES Contributing Editor Tushar Chande has observed that many popular oscillators are highly correlated, which makes sense, because they are measuring the rate of change of the underlying time series.
We use moving averages (low-pass filters) in technical analysis to remove the random noise from a time series, to discern the underlying trend or to determine prices at which we will take action. A perfect moving average:
1 Would be smooth, not sensitive to random noise in the underlying time series. That is, its derivative would not spuriously alternate between positive and negative values.
2 Would not lag behind the time series from which it is computed. Lag, of course, produces late buy or sell signals that kill profits.
The only way a perfect moving average could be computed is to have knowledge of the future, and if we had that, we would buy one lottery ticket a week rather than trade! That aside, we can still improve on conventional simple, weighted, or exponential moving averages.
TWO BENCHMARKS
We will examine two benchmark moving averages based on linear regression analysis. In both cases, a linear regression line of length n is fitted to price data. The first benchmark moving average (MA) is called ILRS, which stands for integral of linear regression slope. In this moving average, the slope of a linear regression line is simply integrated as it is fitted in a moving window of length n across the data. The derivative of ILRS is the linear regression slope. ILRS is not the same as a simple moving average (SMA) of length n, which is actually the midpoint of the linear regression line as it moves across the data.
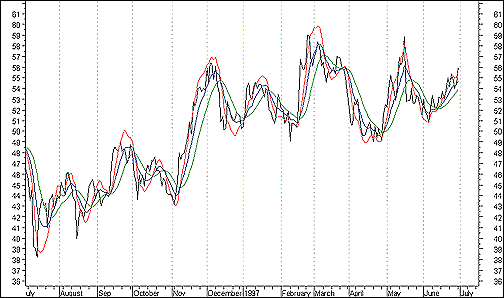
FIGURE 1: HEWLETT-PACKARD. The EPMA(15) is red, the IE/2(15) is blue and the ILRS(15) is green. Note how the EPMA hugs the data more closely than a simple or exponential moving average of the same length. The price we pay for this is that it is much noisier than ILRS, and it also overshoots the data when linear trends are present.
Tim Tillson is a software project manager at Hewlett-Packard, with degrees in mathematics and computer science. He has privately traded options and equities for 15 years. He can be reached at twt@verinet.com.
