NOVICE TRADER
by Thomas Bulkowski
Here's a refresher on the relative strength index, and how to improve your win-loss ratio.
Technical analysts can be divided into two basic camps ? those who rely on charts and those who use indicators. Of course, you can use both methods; you might even want to combine them using statistics. If you know your indicator well enough, you should be able to examine any chart and tell when the indicator is going to signal. That may be part of the secret of being a successful investor: Knowing when your tools work and when they don't; predicting when they will signal, and when they won't.
I am partial to charts. I was a convert from the fundamental camp; it was almost 15 years after I began to invest seriously that I took an interest in the squiggles that a price series makes over time. Later still, I began to believe that reading the charts held some significance. For example, now, I won't buy a stock if I see a bearish reversal forming. I might miss an opportunity, but I'm lowering the risk of losing my shirt.
I haven't given up on the fundamentals, though. I've just added charts and indicators to my toolbox, and that's worked out well. I will tell you this: I don't have any special love for indicators. Many I have tested are profitable only about a third of the time. Of course, when they are correct, they win big, but that is scant comfort at other times. For me, the perfect indicator would be one with a 90% success ratio with a large, quick, payback.
I started exploring indicators a few years ago. I conducted a study on trend channels that took about three months to complete. I learned many things about those channels; among others, I discovered that they failed about half the time. If you bought a stock at the bottom of the regression channel, about half the time the stock would continue down. So I looked for an indicator, or combination of indicators, to improve the win-loss ratio. I found on-balance volume to be good, but I found that the J. Welles Wilder relative strength index was better. I explored the indicator and put it to the test.

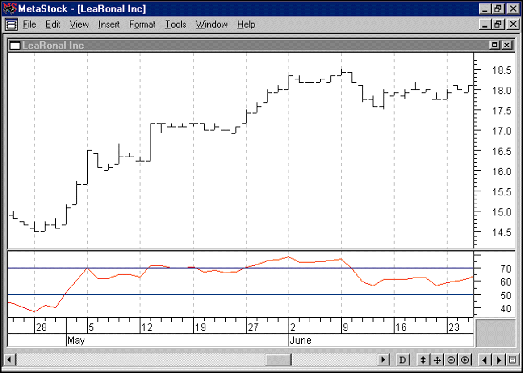
FIGURE 1: RSI (LOWER CHART) CHANGES ON A DIME (RSI USING 16-DAY LOOKBACK AND 70, 50, 30 DASHED LINES). In April 1997, the stock closed down four days in a row. When the stock finally closed up, the RSI moved from trending down to up.
Thomas Bulkowski uses his software engineering skills to further his full-time investment activities.